class: center, middle  ### Introduction to Machine learning with scikit-learn # Trees and Forests Andreas C. Müller Columbia University, scikit-learn .smaller[https://github.com/amueller/ml-training-intro] ??? FIXME bullet points! animation searching for split in tree? categorical data split? predition animation tree? min impurity decrease missing extra tree: only one thereshold per feature? --- class: spacious, middle # Why Trees? ??? - Very powerful modeling method – non-linear! - Doesn’t care about scaling of distribution of data! - “Interpretable” - Basis of very powerful models! - add stacking classifier from PR? --- class: centre,middle # Decision Trees for Classification ??? --- # Idea: series of binary questions .center[ 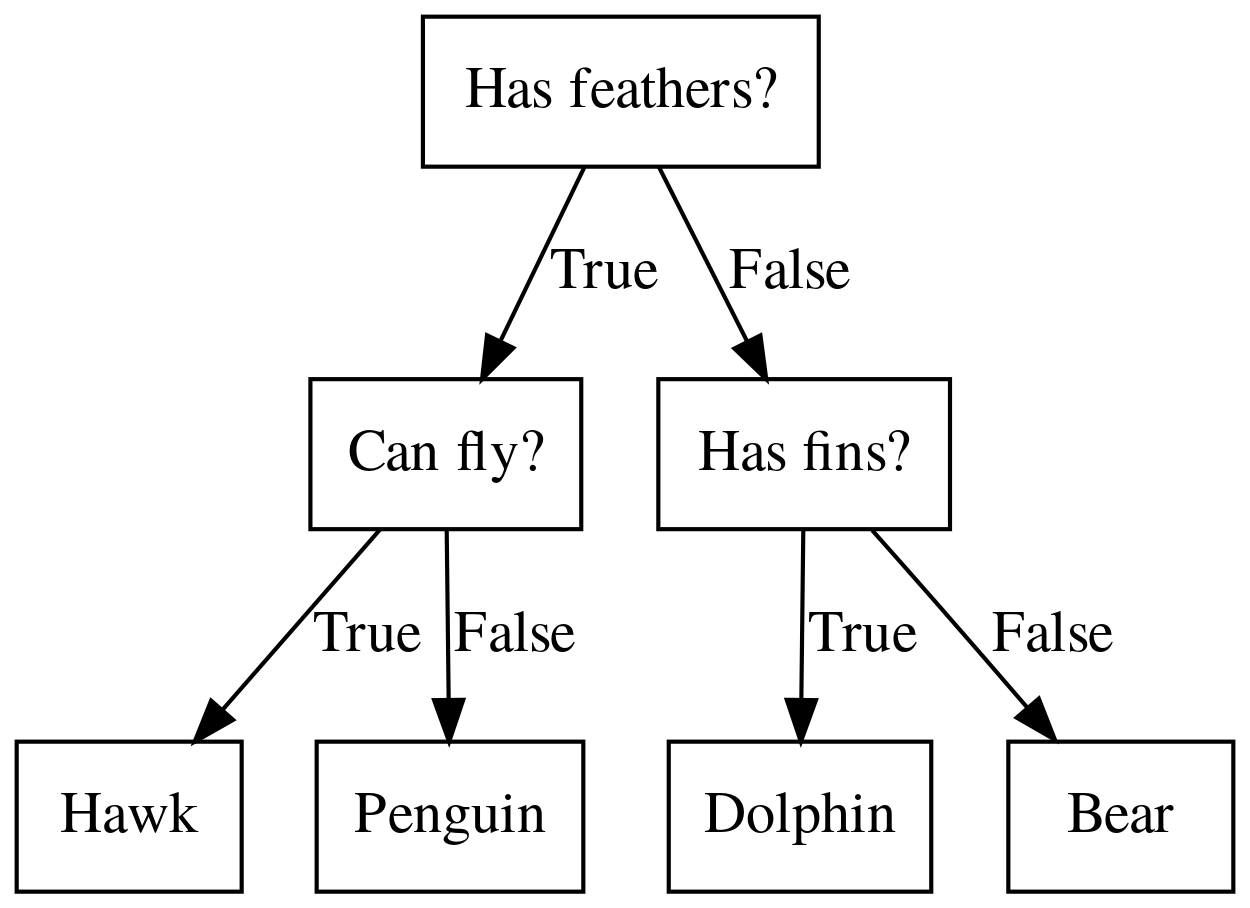 ] ??? --- # Building Trees .left-column[ 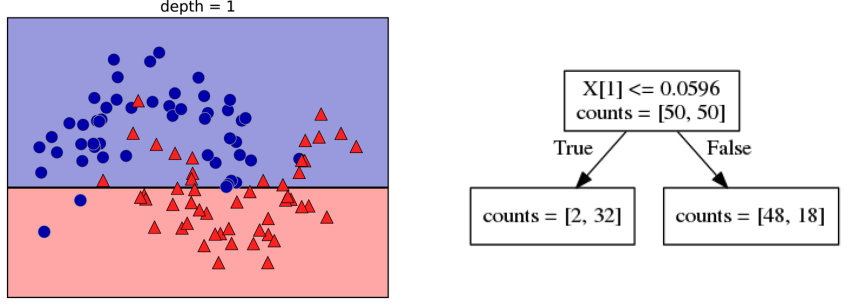 <br /> <br /> Continuous features: - “questions” are thresholds on single features. - Minimize impurity ] .right-column[ 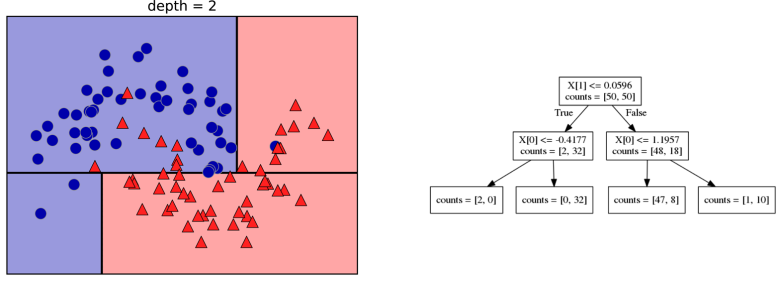 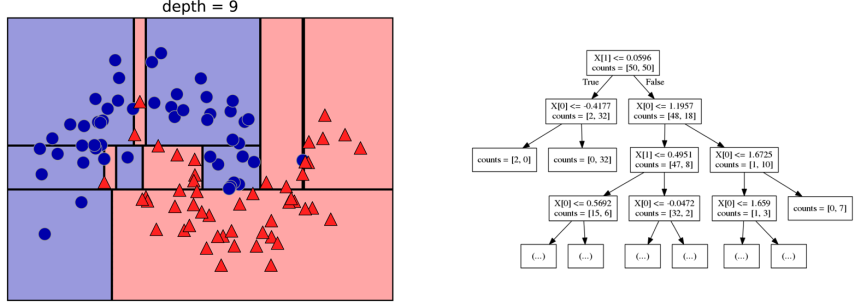 ] ??? Does the layout look okay?? --- # Criteria (for classification) - Gini Index: `$$H_\text{gini}(X_m) = \sum_{k\in\mathcal{Y}} p_{mk} (1 - p_{mk})$$` - Cross-Entropy: `$$H_\text{CE}(X_m) = -\sum_{k\in\mathcal{Y}} p_{mk} \log(p_{mk})$$`  observations in node m  classes  distribution over classes in node m ??? --- # Prediction .center[  ] ??? - Traverse tree based on feature tests - Predict most common class in leaf --- # Regression trees `$$\text{Prediction: } \bar{y}_m = \frac{1}{N_m} \sum_{i \in N_m} y_i $$` Mean Squared Error: `$$ H(X_m) = \frac{1}{N_m} \sum_{i \in N_m} (y_i - \bar{y}_m)^2 $$` Mean Absolute Error: `$$ H(X_m) = \frac{1}{N_m} \sum_{i \in N_m} |y_i - \bar{y}_m| $$` ??? - Without regularization / pruning: - Each leaf often contains a single point to be “pure” --- # Visualizing trees with sklearn .smaller[ ```python from sklearn.datasets import load_breast_cancer cancer = load_breast_cancer() X_train, X_test, y_train, y_test = train_test_split(cancer.data,cancer.target, stratify=cancer.target, random_state=0) from sklearn.tree import DecisionTreeClassifier, export_graphviz tree = DecisionTreeClassifier(max_depth=2) tree.fit(X_train, y_train) # tree visualization tree_dot = export_graphviz(tree, out_file=None, feature_names=cancer.feature_names) print(tree_dot)``` ] ??? --- # Easier visualization [PR #9251](https://github.com/scikit-learn/scikit-learn/pull/9251) (or [a gist](https://gist.github.com/amueller/1f8d3c03305642ab3bad677d9b443b80) ) ```python from tree_plotting import plot_tree tree_dot = plot_tree(tree, feature_names=cancer.feature_names) ``` .center[  ] ??? --- class:spacious # Parameter Tuning - Pre-pruning and post-pruning (not in sklearn yet) - Limit tree size (pick one, maybe two): - max_depth - max_leaf_nodes - min_samples_split - min_impurity_decrease - ... ??? --- class:spacious # No pruning .center[  ] ??? --- class:spacious # max_depth = 4 .center[  ] ??? --- # max_leaf_nodes = 8 .center[  ] ??? --- class:spacious # min_samples_split = 50 .center[  ] ??? --- .smaller[ ```python from sklearn.model_selection import GridSearchCV param_grid = {'max_depth':range(1, 7)} grid = GridSearchCV(DecisionTreeClassifier(random_state=0),param_grid=param_grid, cv=10) grid.fit(X_train, y_train) ``` ] .center[  ] ??? --- .smaller[ ```python from sklearn.model_selection import GridSearchCV param_grid = {'max_leaf_nodes':range(2, 20)} grid = GridSearchCV(DecisionTreeClassifier(random_state=0), param_grid=param_grid, cv=10) grid.fit(X_train, y_train) ``` ] .center[ 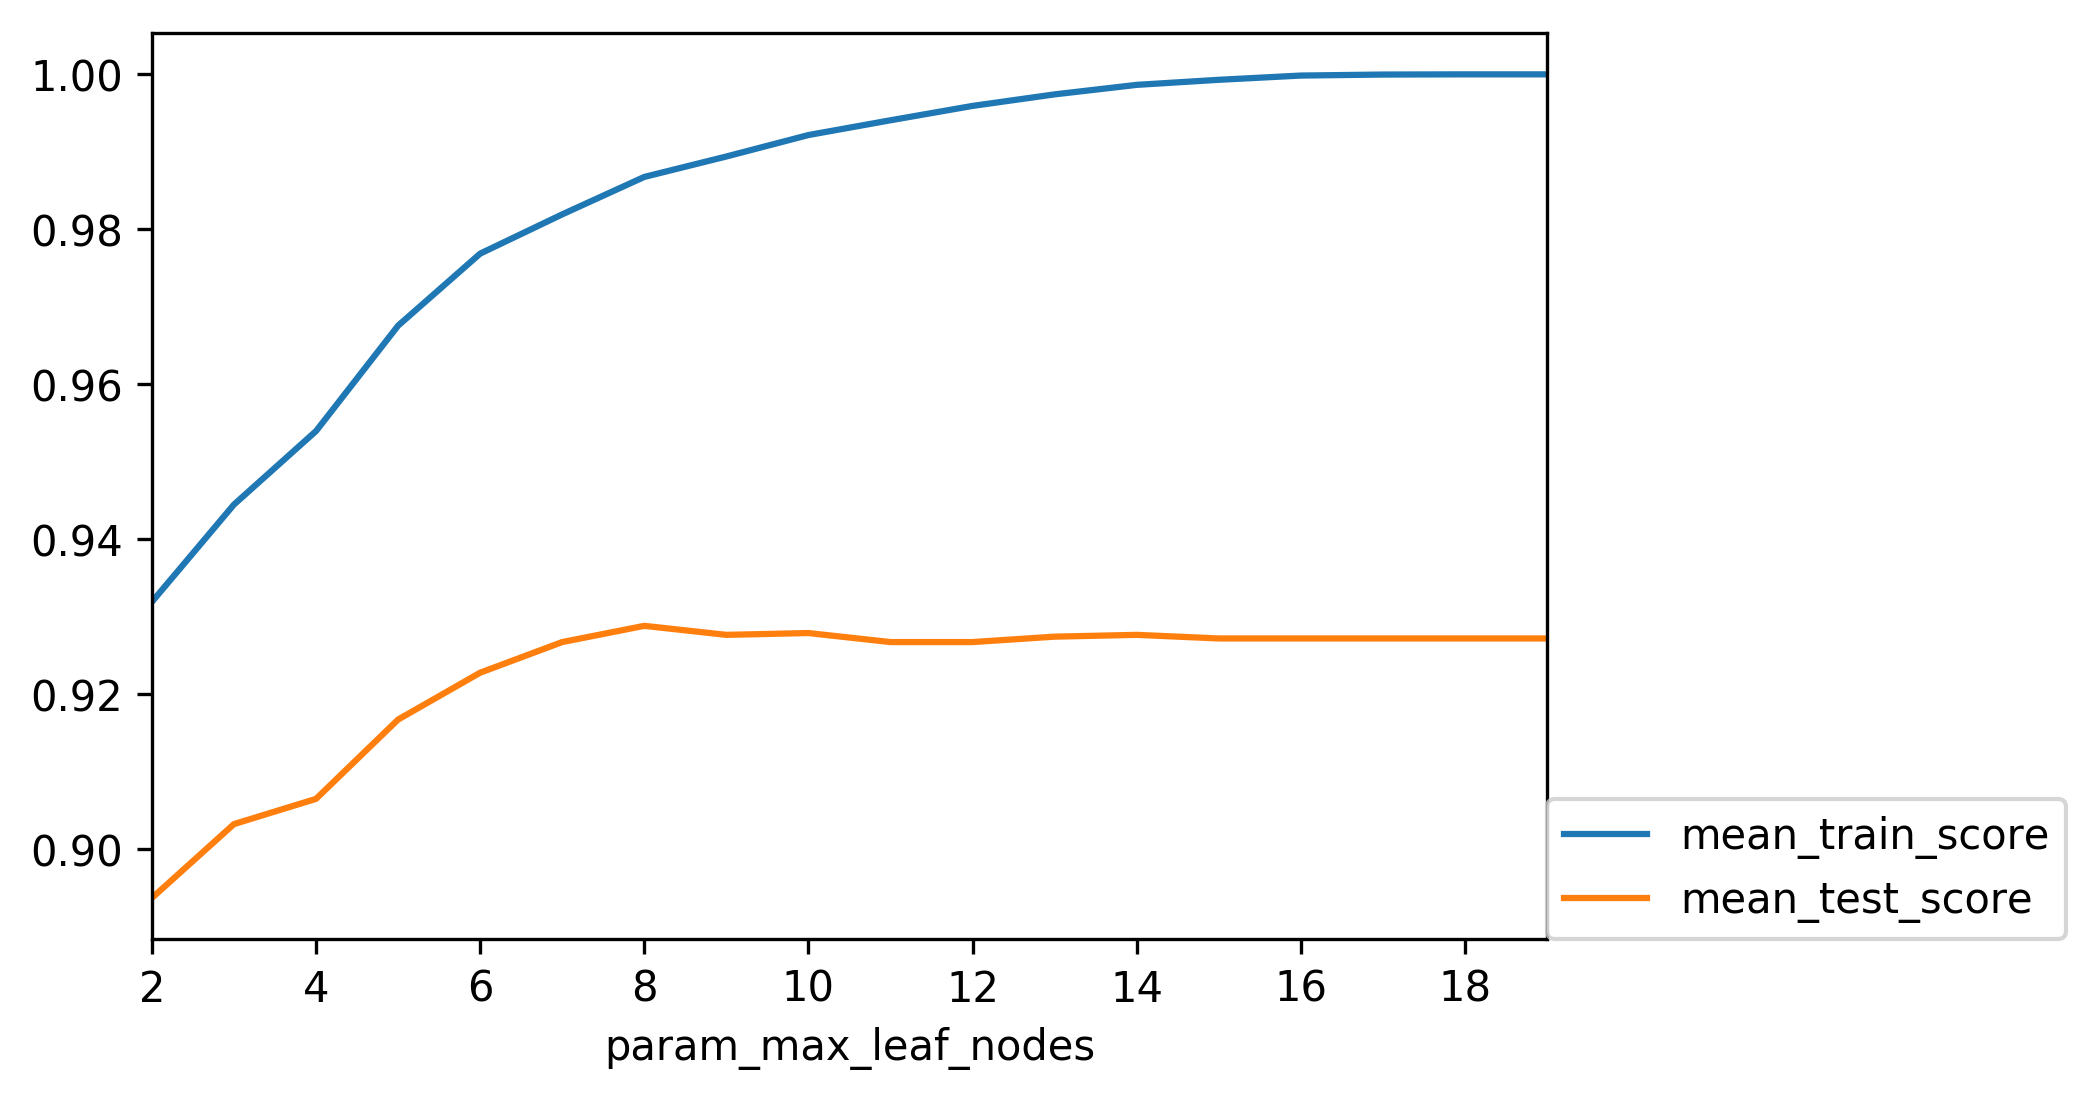 ] ??? --- #Extrapolation .center[ 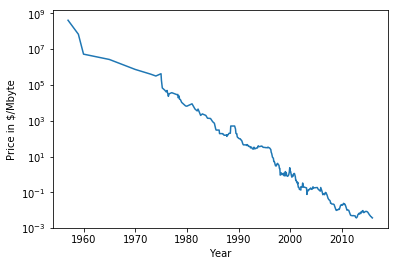 ] ??? --- #Extrapolation .center[ 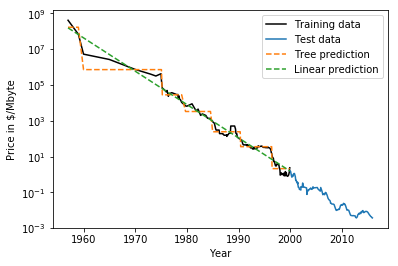 ] ??? --- #Extrapolation .center[ 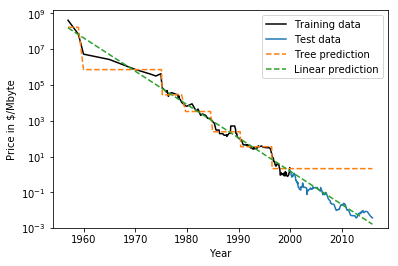 ] ??? --- # Instability .left-column[ .tiny-code[ ```python X_train, X_test, y_train, y_test = train_test_split( iris.data, iris.target, stratify=iris.target, random_state=0) tree = DecisionTreeClassifier(max_leaf_nodes=6) tree.fit(X_train, y_train) ``` ] 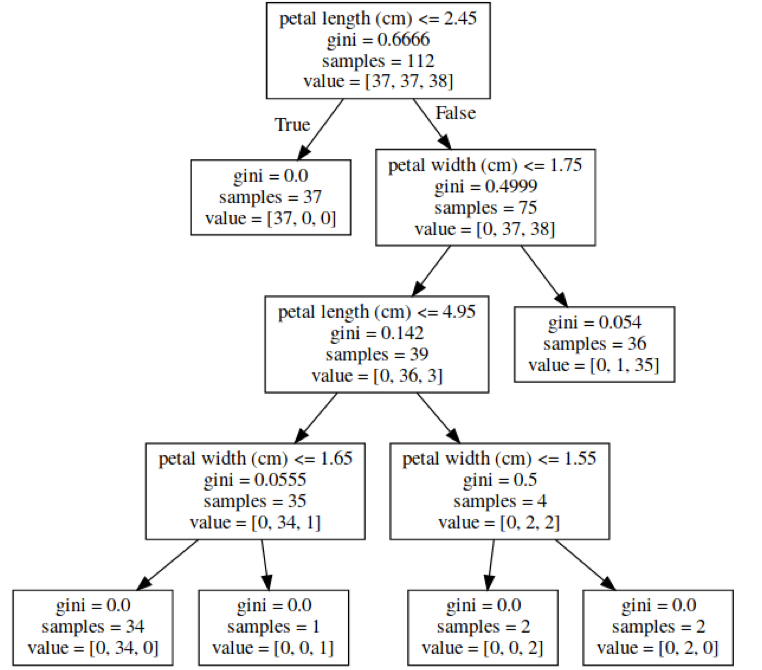 ] .right-column[ .tiny-code[```python X_train, X_test, y_train, y_test = train_test_split( iris.data, iris.target, stratify=iris.target, random_state=1) tree = DecisionTreeClassifier(max_leaf_nodes=6) tree.fit(X_train, y_train) ``` ] .center[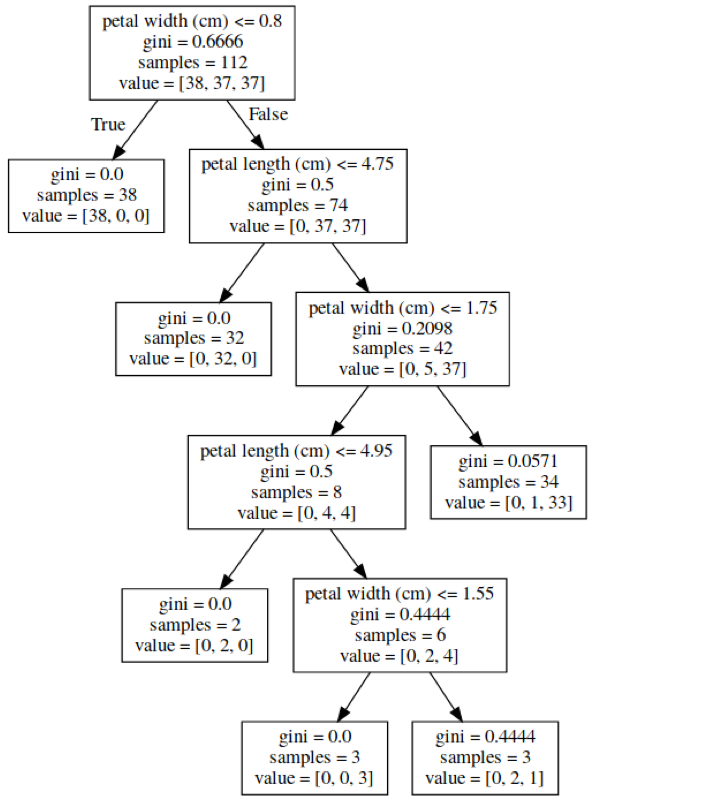 ]] ???. --- class: spacious # Random Forests .center[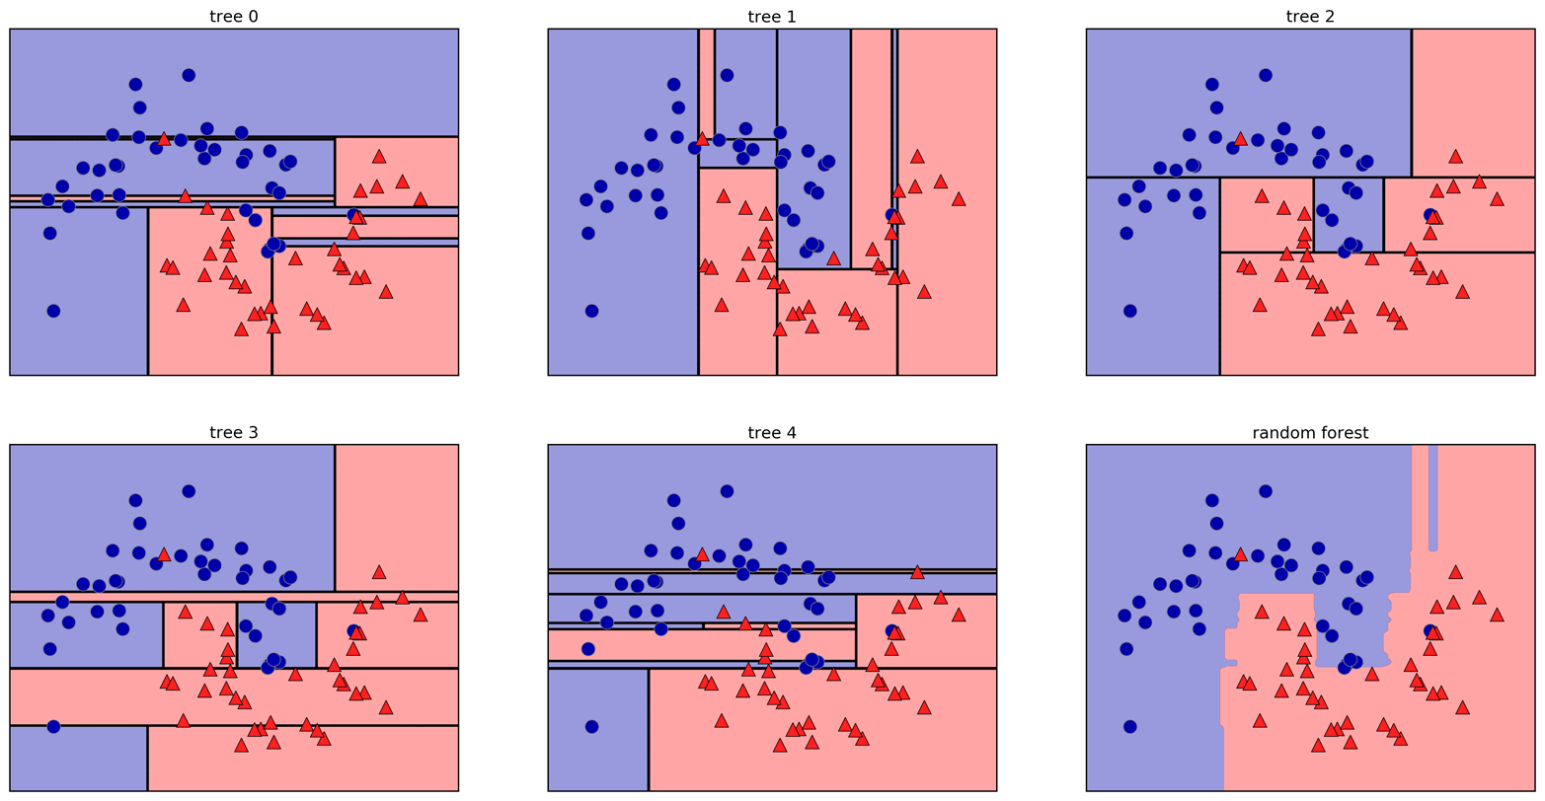] ??? - Smarter bagging for trees! --- # Randomize in two ways .left-column[ - For each tree: - Pick bootstrap sample of data - For each split: - Pick random sample of features - More trees are always better ] .right-column[  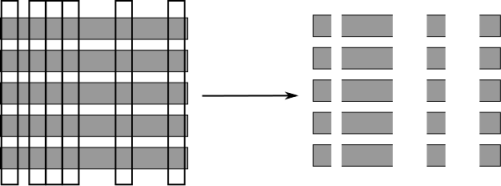 ] ??? --- class:some-space # Tuning Random Forests - Main parameter: max_features - around sqrt(n_features) for classification - Around n_features for regression - n_estimators > 100 - Prepruning might help, definitely helps with model size! - max_depth, max_leaf_nodes, min_samples_split again ??? --- # Variable Importance .smaller[ ```python X_train, X_test, y_train, y_test = train_test_split( iris.data, iris.target, stratify=iris.target, random_state=1) rf = RandomForestClassifier(n_estimators=100).fit(X_train, y_train) rf.feature_importances_ plt.barh(range(4), rf.feature_importances_) plt.yticks(range(4), iris.feature_names); ``` ```array([ 0.126, 0.033, 0.445, 0.396])``` ] .center[ 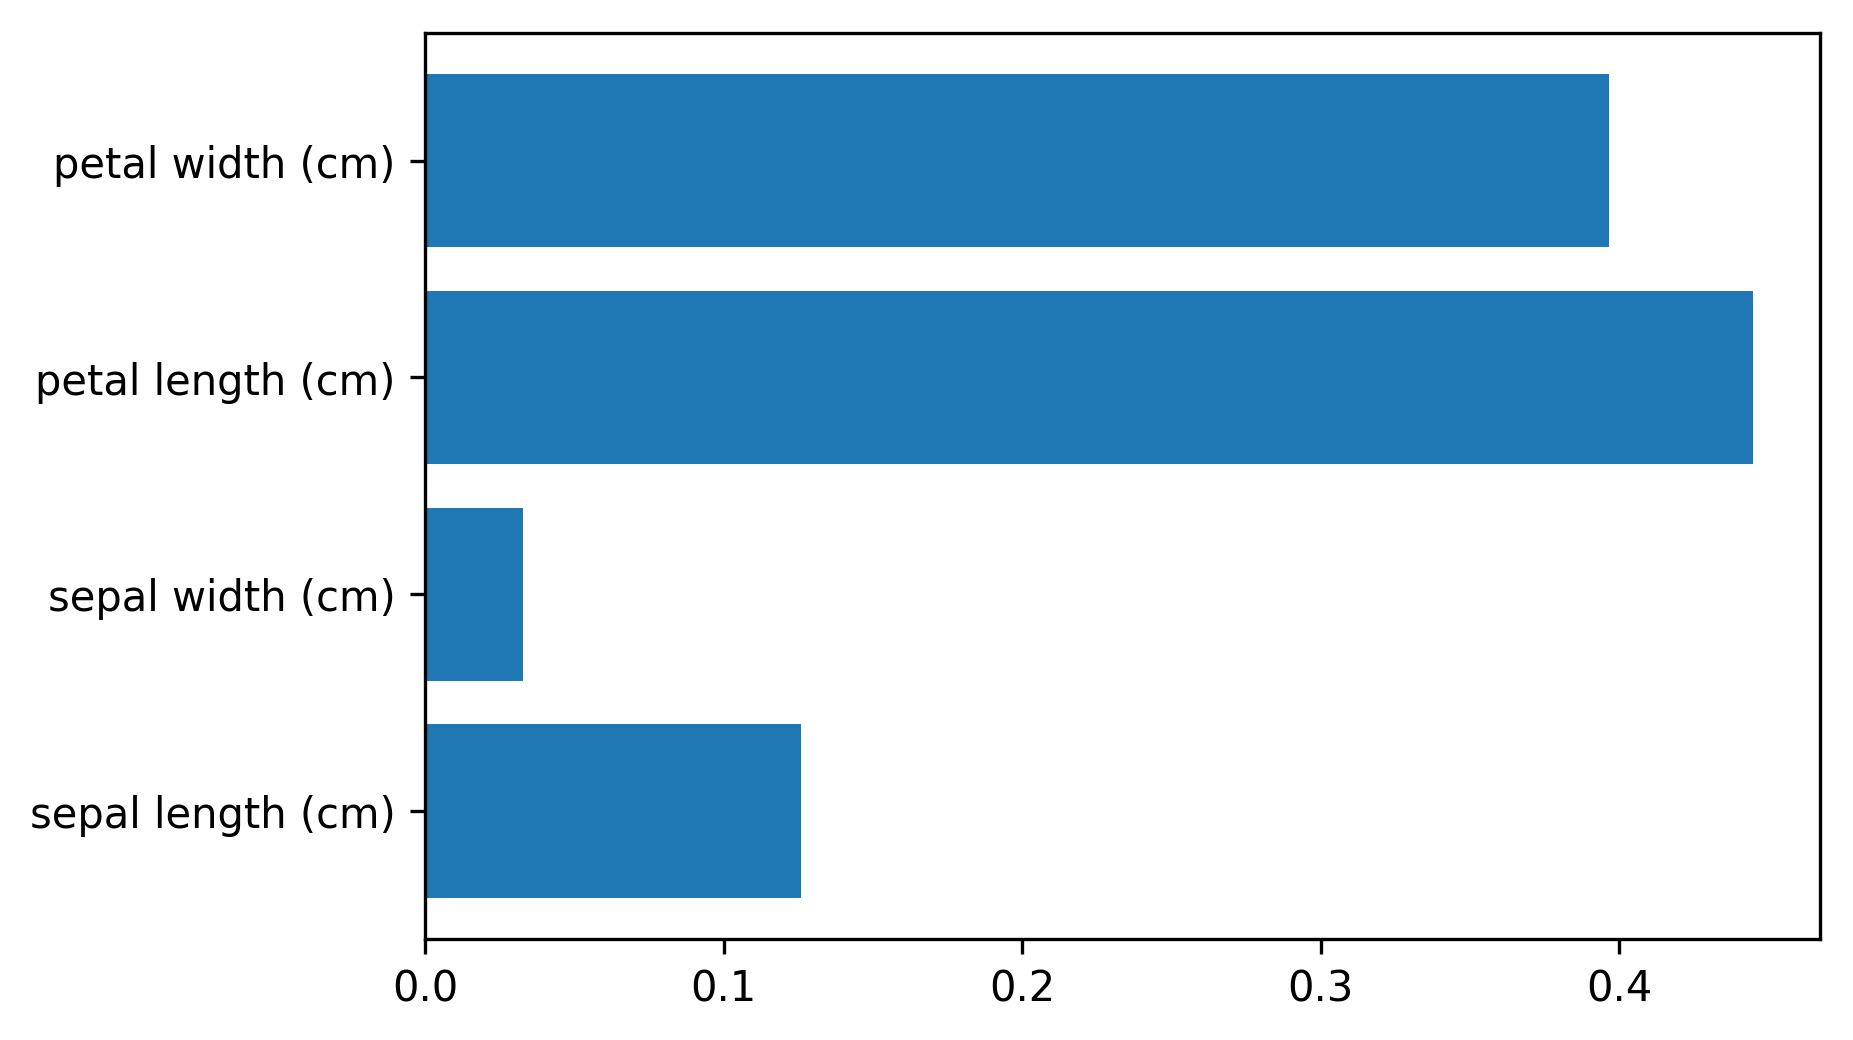 ]