Note
Click here to download the full example code
Image-colored wordcloud with boundary map
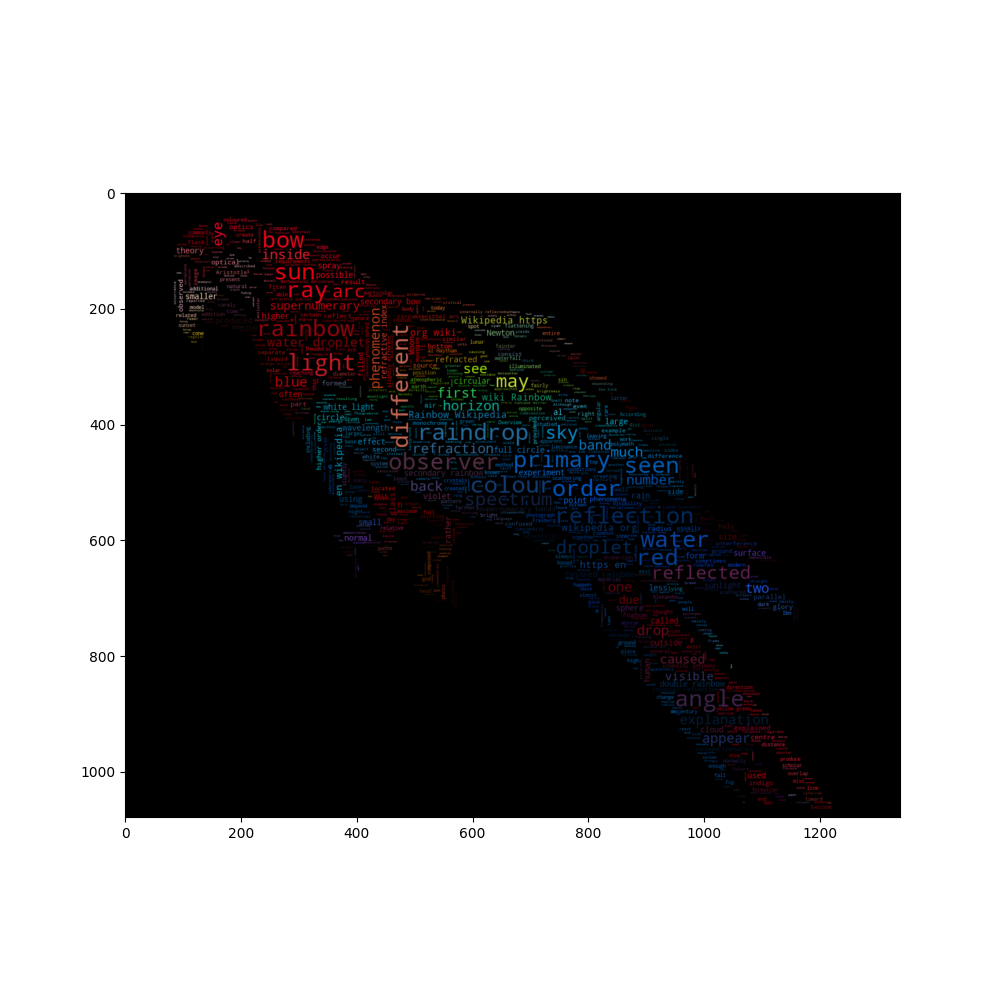
A slightly more elaborate version of an image-colored wordcloud that also takes edges in the image into account. Recreating an image similar to the parrot example.
import os
from PIL import Image

import numpy as np
import matplotlib.pyplot as plt
from scipy.ndimage import gaussian_gradient_magnitude

from wordcloud import WordCloud, ImageColorGenerator

# get data directory (using getcwd() is needed to support running example in generated IPython notebook)
d = os.path.dirname(__file__) if "__file__" in locals() else os.getcwd()

# load wikipedia text on rainbow
text = open(os.path.join(d, 'wiki_rainbow.txt'), encoding="utf-8").read()

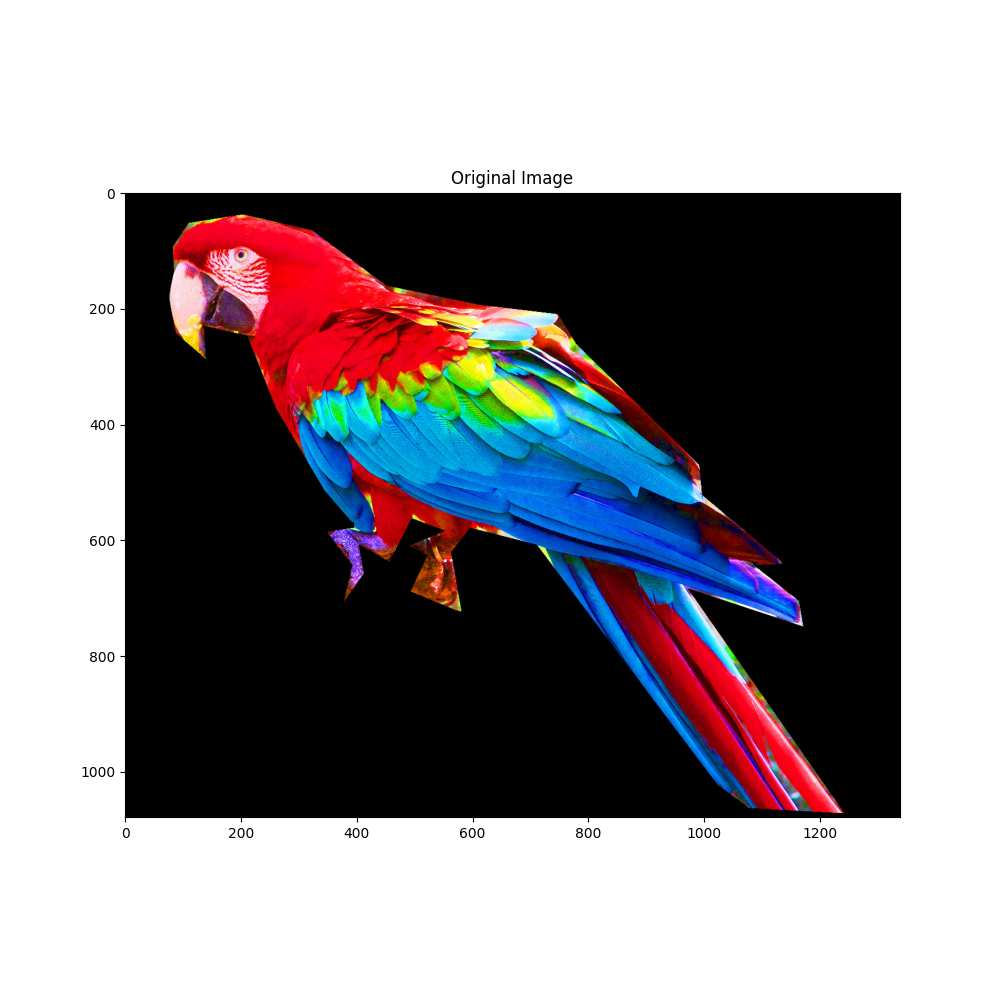
# load image. This has been modified in gimp to be brighter and have more saturation.
parrot_color = np.array(Image.open(os.path.join(d, "parrot-by-jose-mari-gimenez2.jpg")))
# subsample by factor of 3. Very lossy but for a wordcloud we don't really care.
parrot_color = parrot_color[::3, ::3]

# create mask  white is "masked out"
parrot_mask = parrot_color.copy()
parrot_mask[parrot_mask.sum(axis=2) == 0] = 255

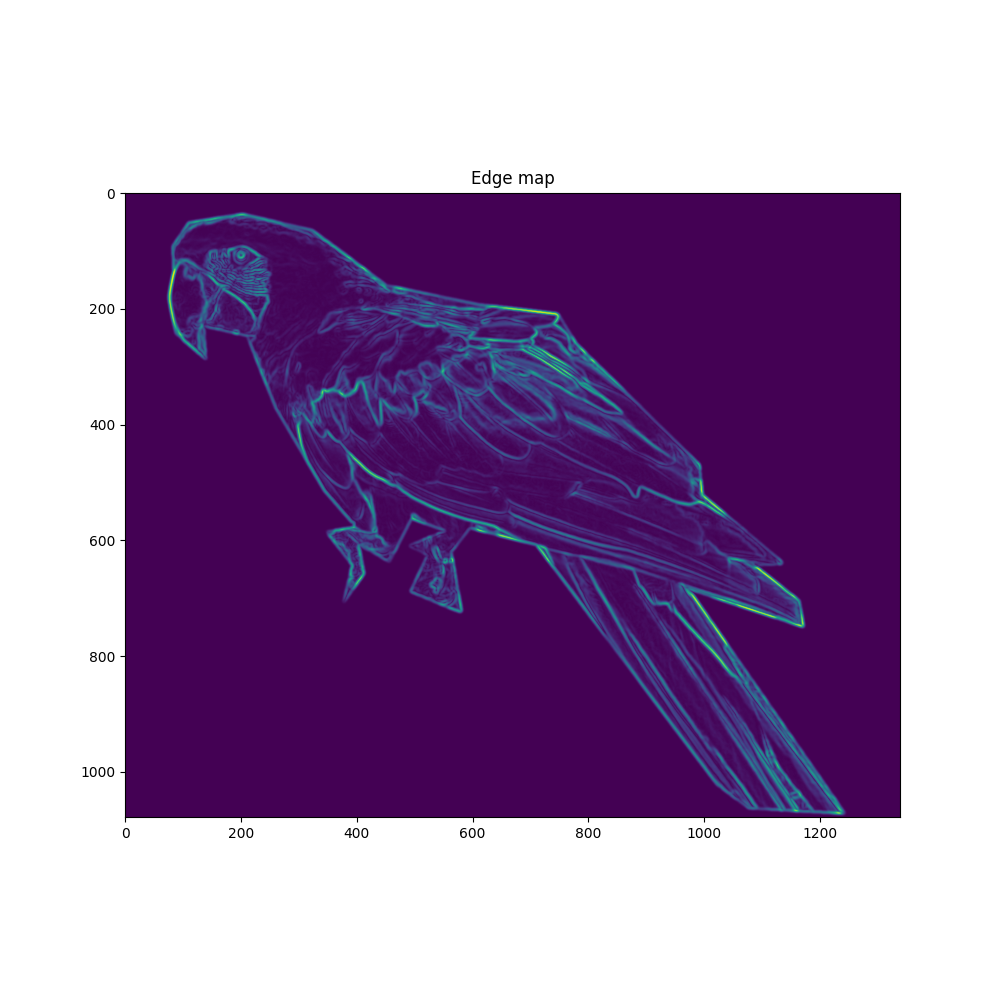
# some finesse: we enforce boundaries between colors so they get less washed out.
# For that we do some edge detection in the image
edges = np.mean([gaussian_gradient_magnitude(parrot_color[:, :, i] / 255., 2) for i in range(3)], axis=0)
parrot_mask[edges > .08] = 255

# create wordcloud. A bit sluggish, you can subsample more strongly for quicker rendering
# relative_scaling=0 means the frequencies in the data are reflected less
# acurately but it makes a better picture
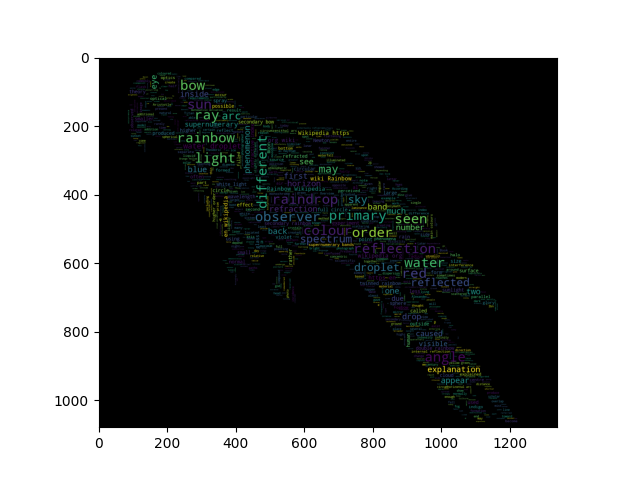
wc = WordCloud(max_words=2000, mask=parrot_mask, max_font_size=40, random_state=42, relative_scaling=0)

# generate word cloud
wc.generate(text)
plt.imshow(wc)

# create coloring from image
image_colors = ImageColorGenerator(parrot_color)
wc.recolor(color_func=image_colors)
plt.figure(figsize=(10, 10))
plt.imshow(wc, interpolation="bilinear")
wc.to_file("parrot_new.png")

plt.figure(figsize=(10, 10))
plt.title("Original Image")
plt.imshow(parrot_color)

plt.figure(figsize=(10, 10))
plt.title("Edge map")
plt.imshow(edges)
plt.show()
Total running time of the script: ( 0 minutes 21.403 seconds)


