import numpy as np
plt.rcParams["savefig.dpi"] = 300
plt.rcParams["savefig.bbox"] = "tight"
np.set_printoptions(precision=3, suppress=True)

import time
from scipy.stats import randint as sp_randint

from sklearn.model_selection import GridSearchCV
from sklearn.model_selection import RandomizedSearchCV
from sklearn.datasets import load_digits, fetch_openml
from sklearn.ensemble import RandomForestClassifier
from sklearn.model_selection import train_test_split
import pandas as pd

import matplotlib.pyplot as plt
% matplotlib inline

from joblib import Memory

mem = Memory(location='/tmp')

# get some data
digits = load_digits()
X, y = digits.data, digits.target
@mem.cache
def bla():
    mnist = fetch_openml("mnist_784")
    return mnist.data, mnist.target

# X, y = bla()
X_train, X_test, y_train, y_test = train_test_split(X, y, stratify=y, random_state=0)
Parameter Tuning and AutoML
training size in SVC
Parameter Tuning and AutoML
03/30/20
Andreas C. Müller
FIXME successive halving and hyperband explaination with budget is too confusing, don’t need it FIXME add neural networks to meta-model FIXME bullet points FIXME show figure 2x random is as good as hyperband? FIXME needs lots more polish! FIXME too long?! what?! how?! FIXME difference between hyperband and SuccessiveHalving unclear
Motivation
Need to select among Models
Need to select Hyper-Parameters
Need to select among preprocessing methods
Conditional Hyper-Parameters
Kernels
Neural Nets
Pipelines
Formulating model-selection as Hyperparameter Optimization
One big search, many conditional Hyper-Parameters
Categorical, integer, continuous, conditional
Different distributions
CASH problem
Find the best configuration
Global optimization on complex (high-dim?) space
Issues with Grid-Search
Need to define Grid
Exponential in number of dims
Black-Box Search Procedures
Parameters \(\Lambda\), model-evaluation \(f\).
General optimization of unknown, non-differentiable f, possibly no-smooth. NP Hard in general. Function f is very slow to evaluate - think training a neural net for a week.
Random Search
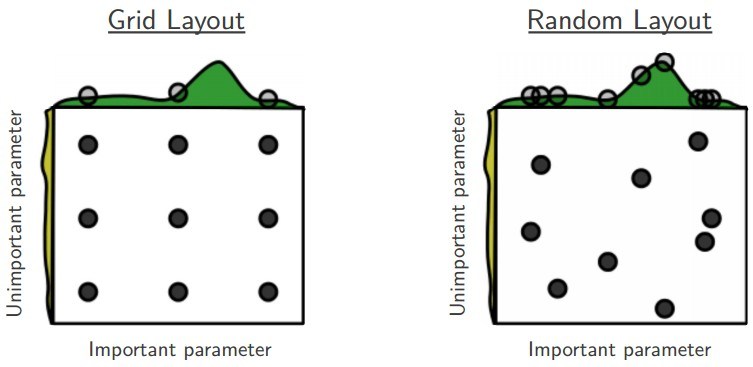
Random Search with scikit-learn
## specify parameters and distributions to sample from
from scipy.stats import randint
param_dist = {"max_depth": [3, None],
              "max_features": randint(1, 11),
              "min_samples_split": randint(2, 11),
              "bootstrap": [True, False],
              "criterion": ["gini", "entropy"]}
random_search = RandomizedSearchCV(clf,
                                   param_distributions=param_dist,
                                   n_iter=200)
lists or objects with
rvsmethodUse continuous distributions for biggest advantage
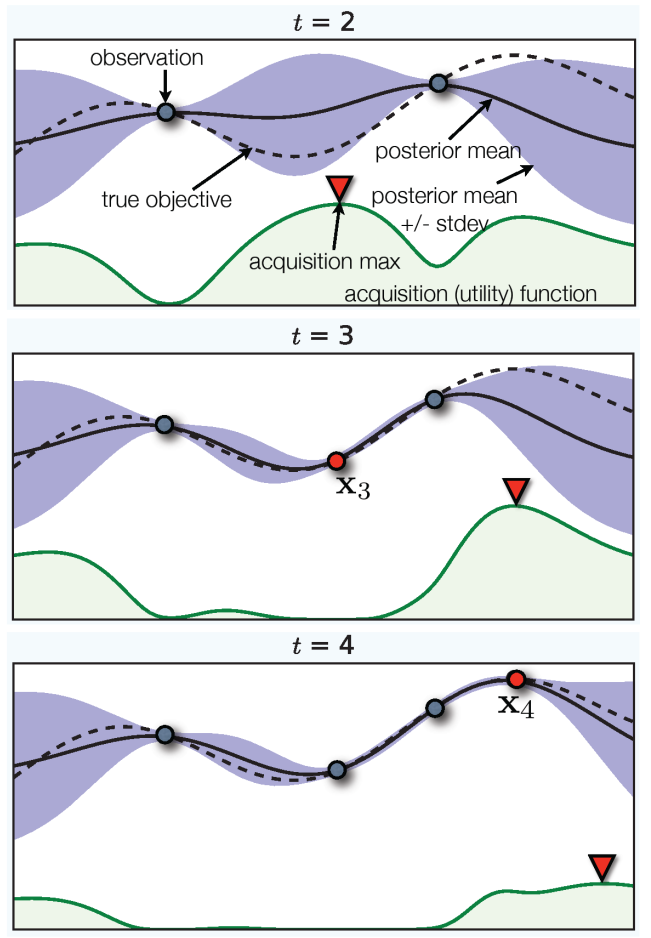
Bayesian Optimization, SMBO
.wide-left-column[
fit ‘cheap’ probabilistic function to black-box
pick next point using exploration / exploitation
Implemented as acquisition function ] .narrow-right-column[ .center[
 ]]
]]
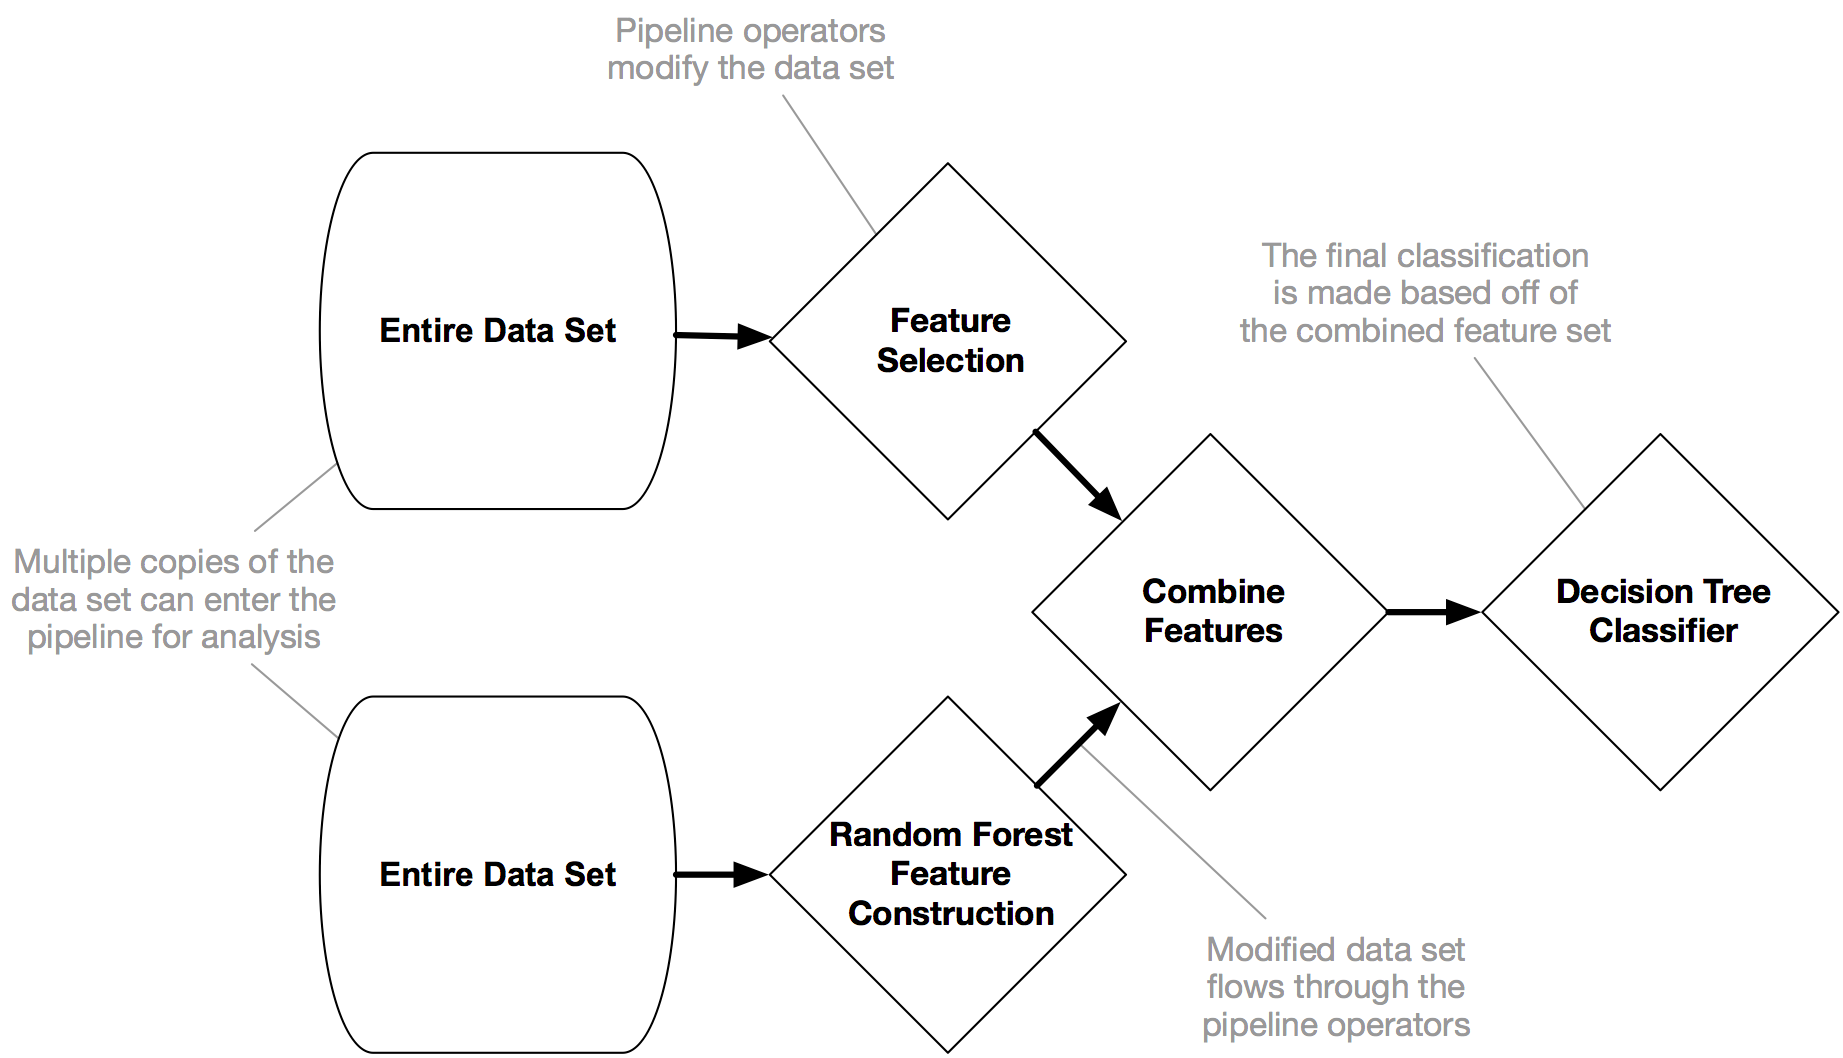
Evolutionary Methods: TPOT
.center[
 ]
]
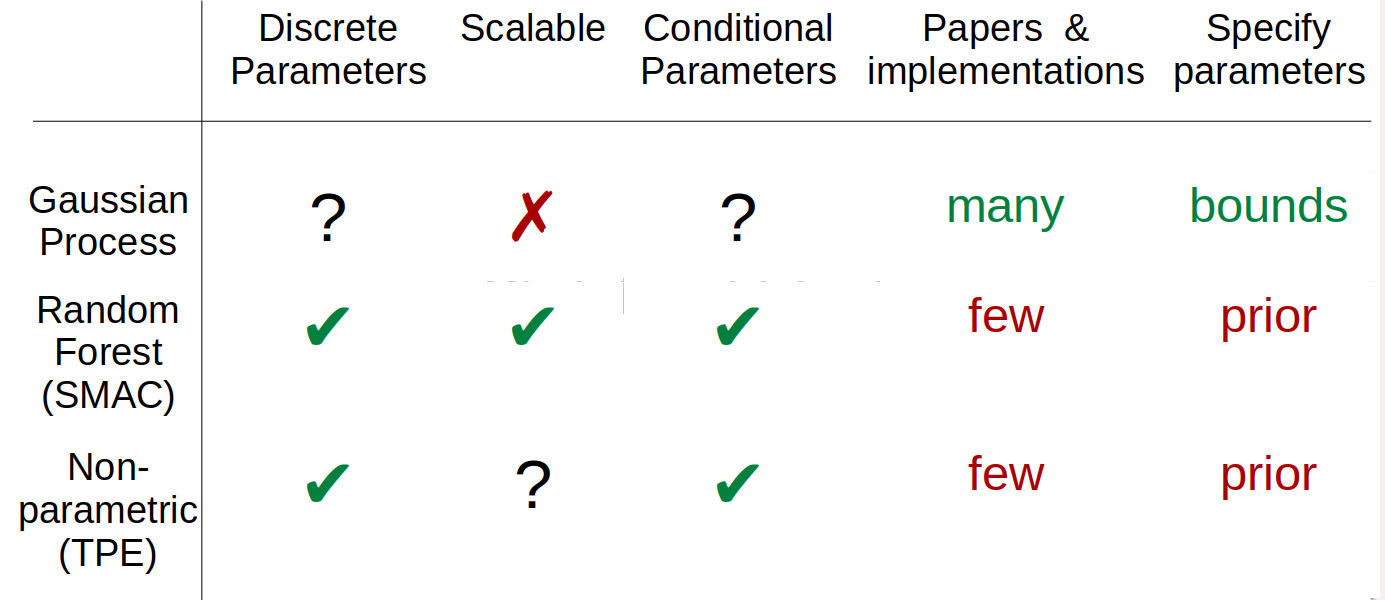
Implementations
SMAC: Random Forest model (Hutter group)
spearmint: GP (Snoek et al)
hyperopt: TPE (Bergstra, not maintained)
scikit-optimize: GP, tree, etc
GPyOpt: GP based on GPy (Lawrence group)
Criticism
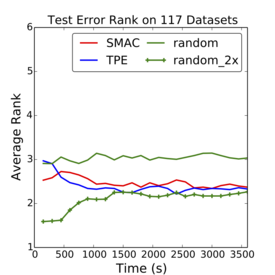
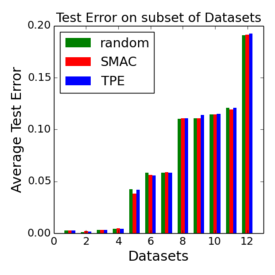
–
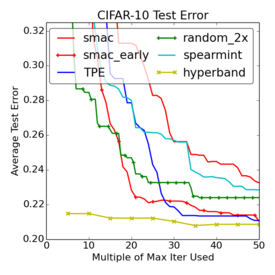
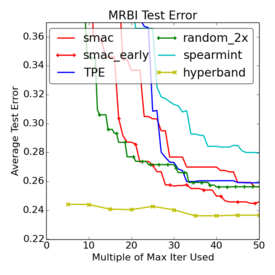
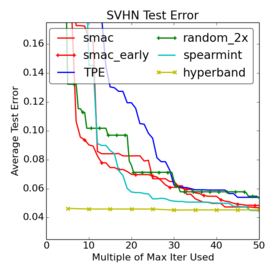
.smallest[http://www.argmin.net/2016/06/20/hypertuning/]
FIXME use newer hyperband figures!
Beyond Black-Box
Hyperparameter gradient descent
Multi-Fidelity optimization
Meta-learning
(others…)
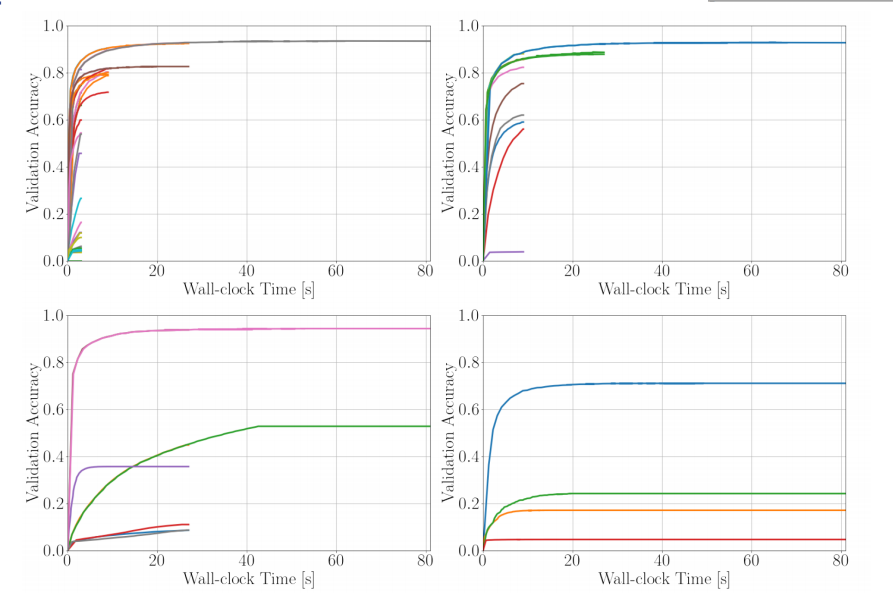
Multi-Fidelity Search
.smaller[Approximate function by similar cheaper function]
.center[


]
Top: subsample the datasets bottom: use less trees in forest
Multi-Fidelity Bayesian Optimization
Fit model to performance given parameters and budget
Choose parameters and budget for best exploration / exploitation
Related to multi-armed bandits and A/B testing
Differences to bandits:
non-stationary distributions
receiving loss (computing validation error) is expensive
possibly infinitely many arms (continuous parameters)
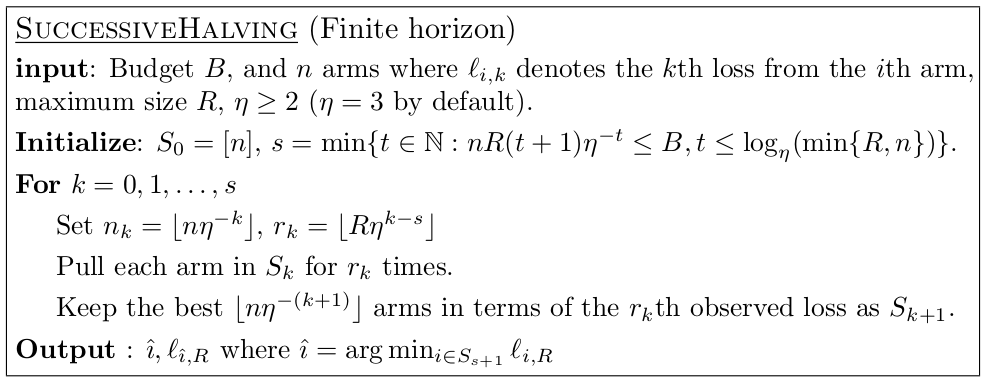
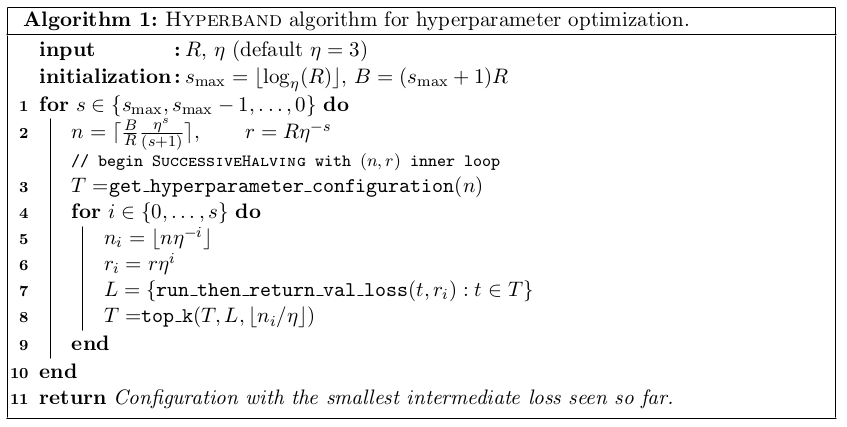
Successive Halving
Given \(n\) configuration and budget \(B\)
pick \(\eta=2\) or \(\eta=3\) (wording follows 2)
Each iteration, keep best halve of configurations
after \(k=\log_\eta(n) + 1\) left with single configuration.
initially allocate \(\frac{B}{kn}\) to each configuration, double each iteration (exact budget is slightly more complicated, see algorithm). –
Successive Halving Example
configurations n=81
total budget B=20000
train 81 configurations with resources   41
train 27 configurations with resources  123
train  9 configurations with resources  370
train  3 configurations with resources 1111
train  1 configurations with resources 3333
resources total: 16638
Think about resources as in “maximum number of trees build in total” or “maximum number of data points used in total”.
Successive Halving (different) Example
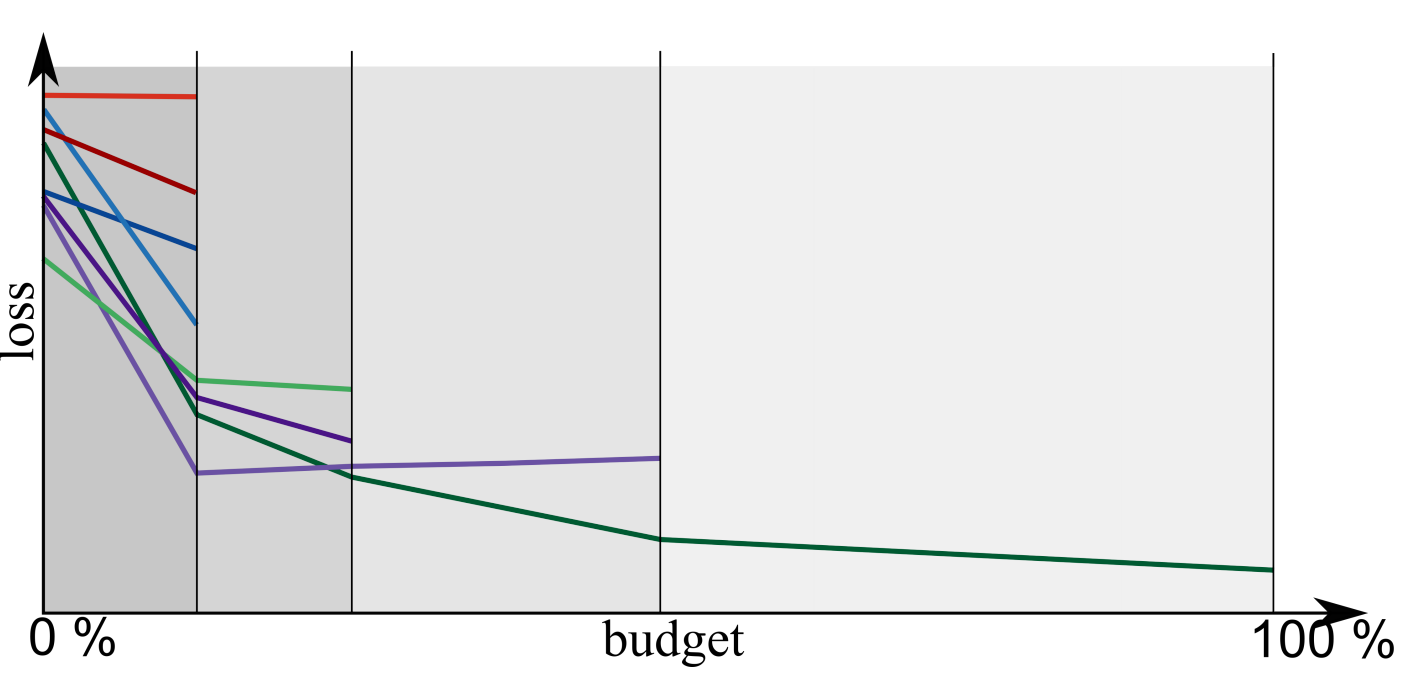
Hyperband
.center[
 ]
]
Hyperband
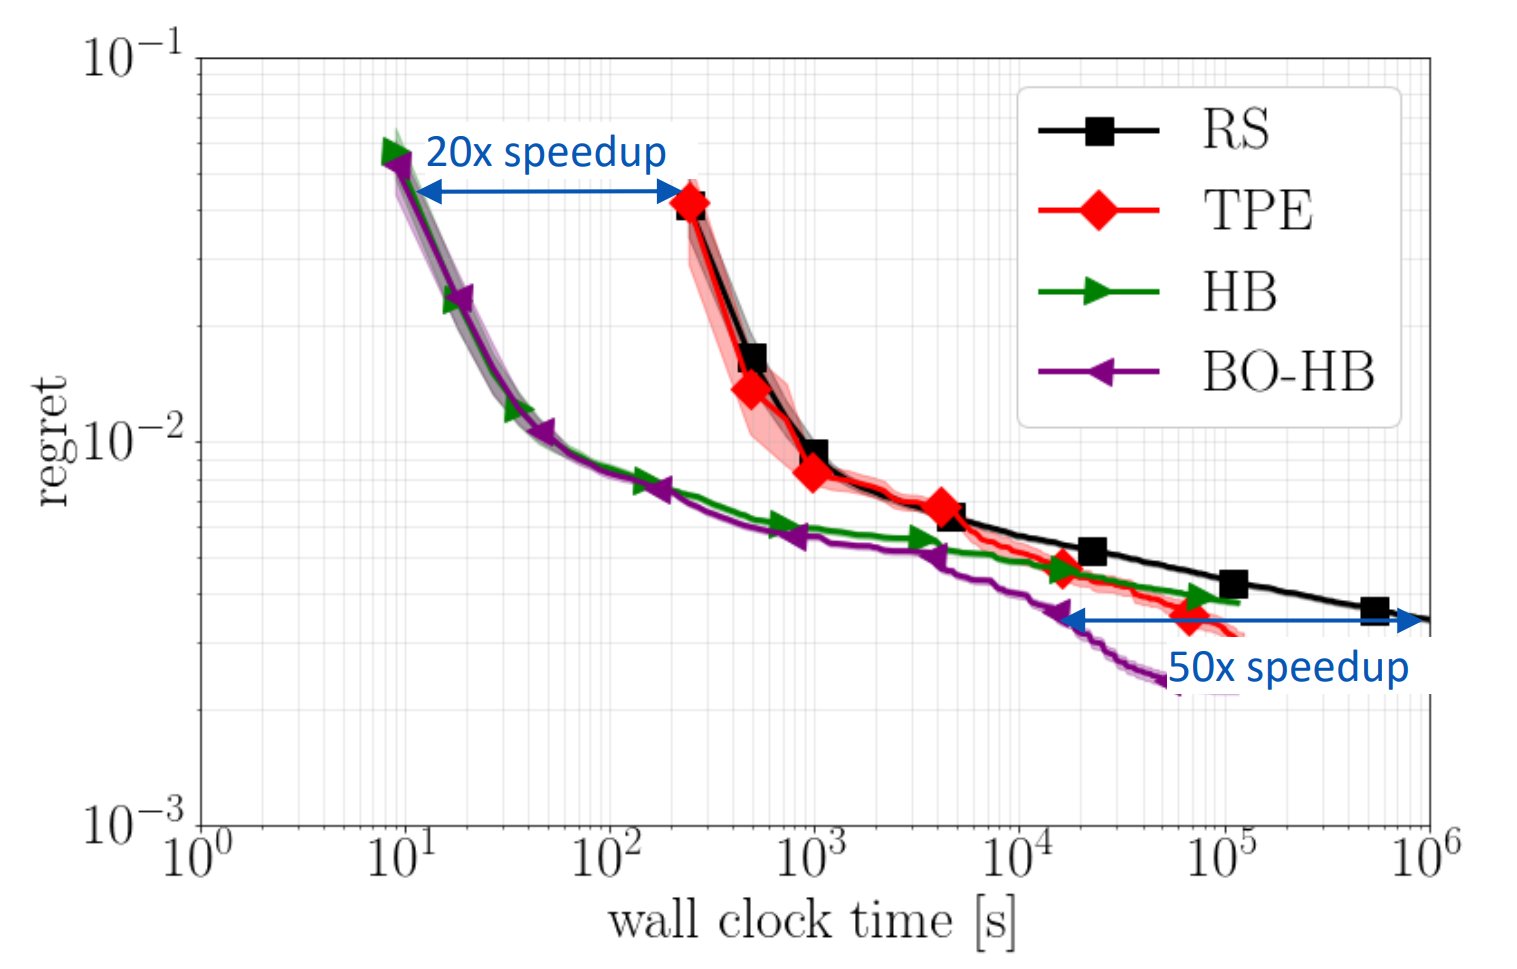
BOHB / HpBandSter
.center[
 ]
]
In Practice
“With the exception of the LeNet experiment (Section 3.3) and the 117 Datasets experi- ment (Section 4.2.1), the most aggressive bracket of SuccessiveHalving outperformed Hyperband in all of our experiments.” .quote_author[Li et. al.]
Soon (?) in sklearn (discussion)
HpBandSter distributed implementation, some custom code required
scikit-hyperband looks good, but doesn’t do out-of-the-box subsampling
Successive halving really easy to implement yourself.
Ranking
Run many algorithms on large array of datasets
Rank by “best on average”
Portfolios
Create diverse set so that a good one among top k
Submodular optimization problem
greedy approximation
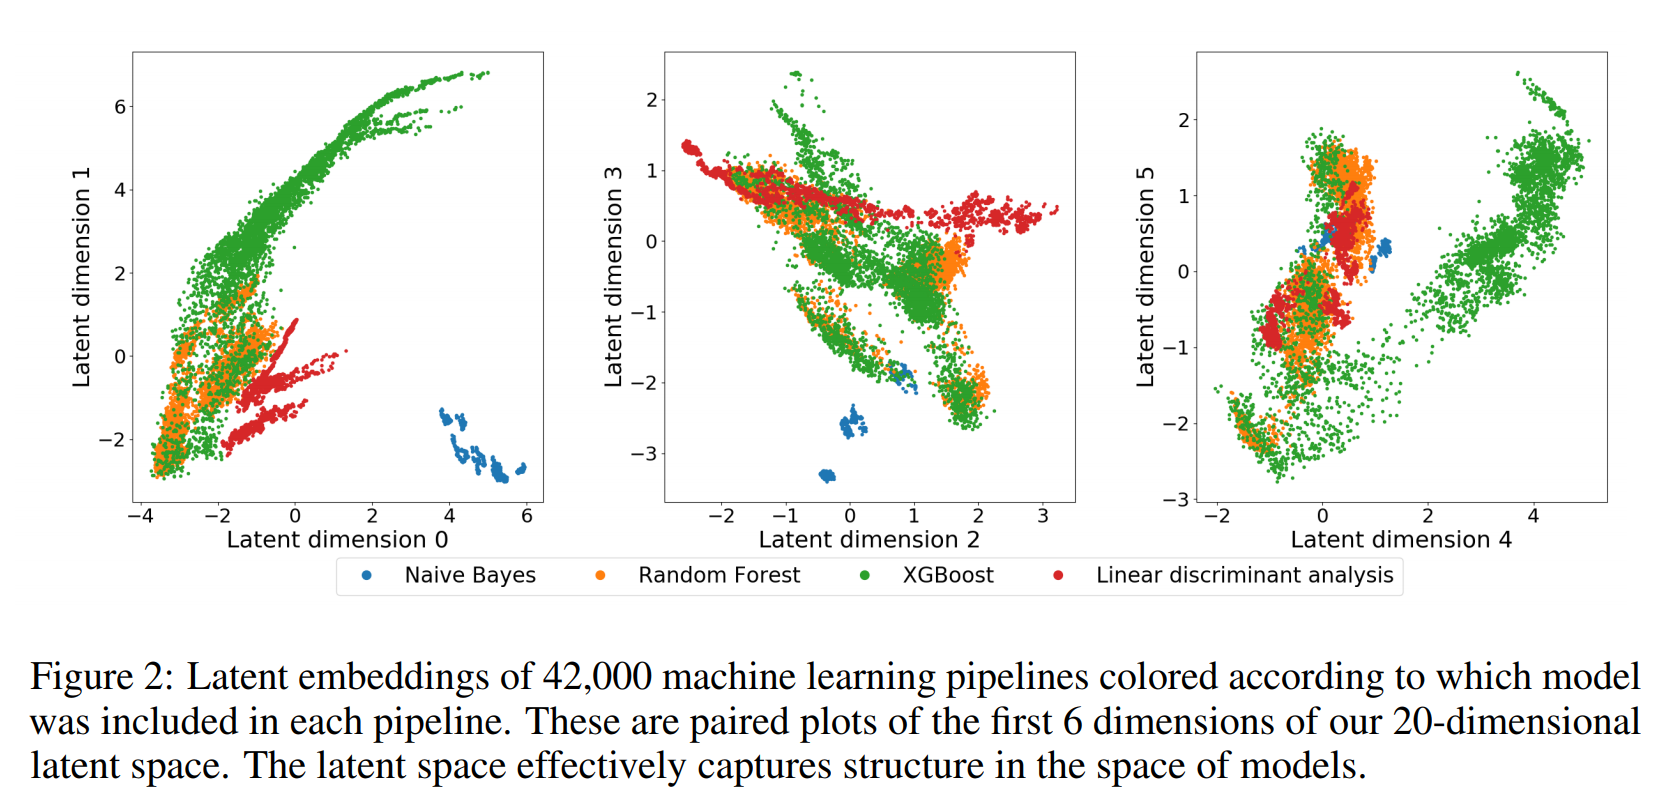
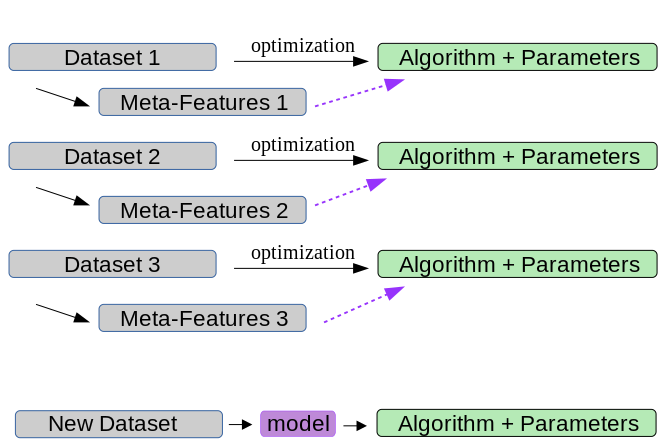
Meta-Features and Meta-Models
.center[
 ]
]
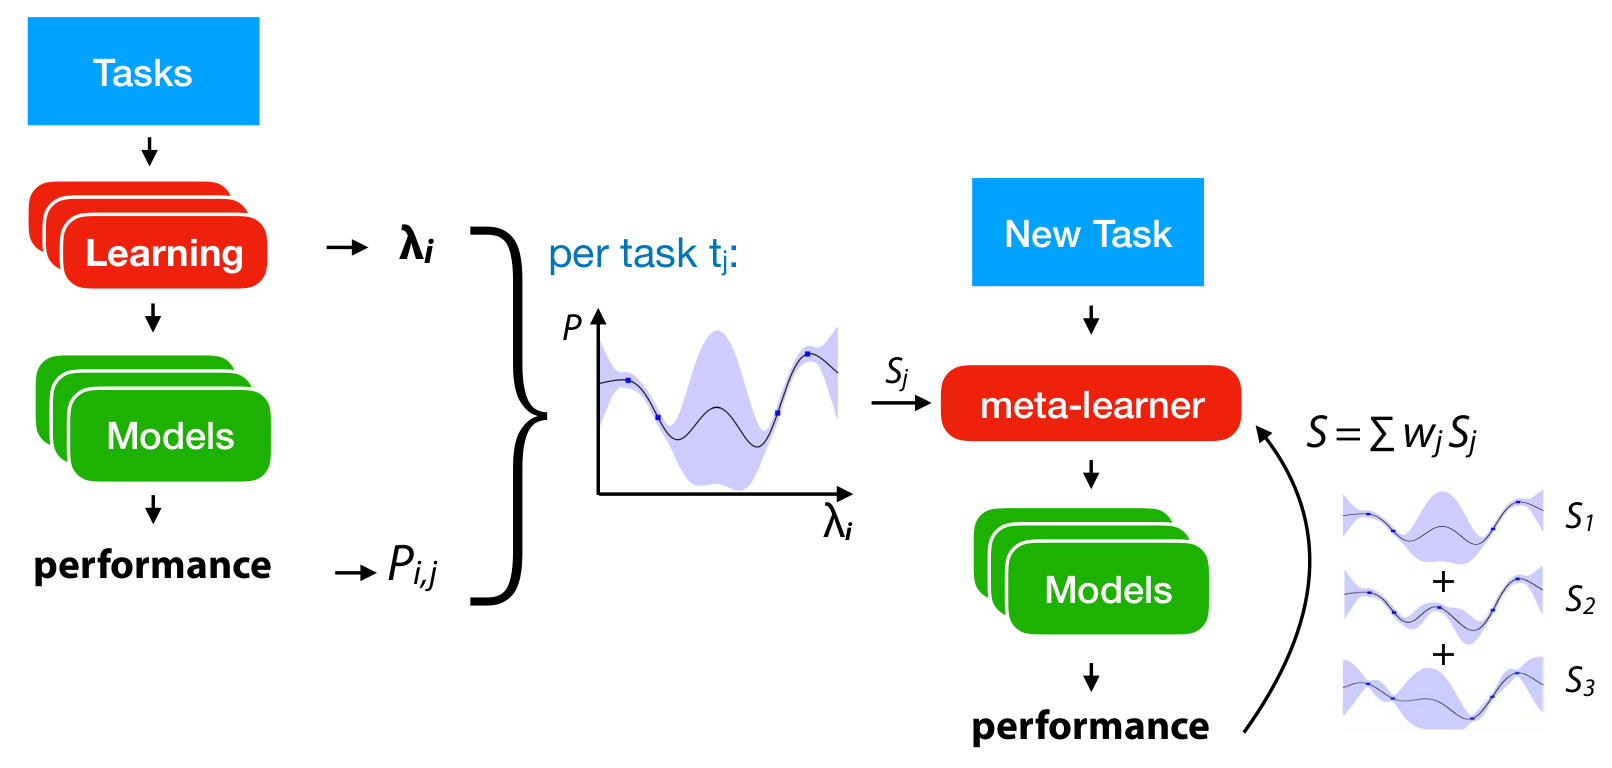
Multi-Task Bayesian Optimization
Create estimate over all datasets at the same time!
Not scalable with Gaussian Processes
Maybe scalable with Neural Networks?
Ensemble Models
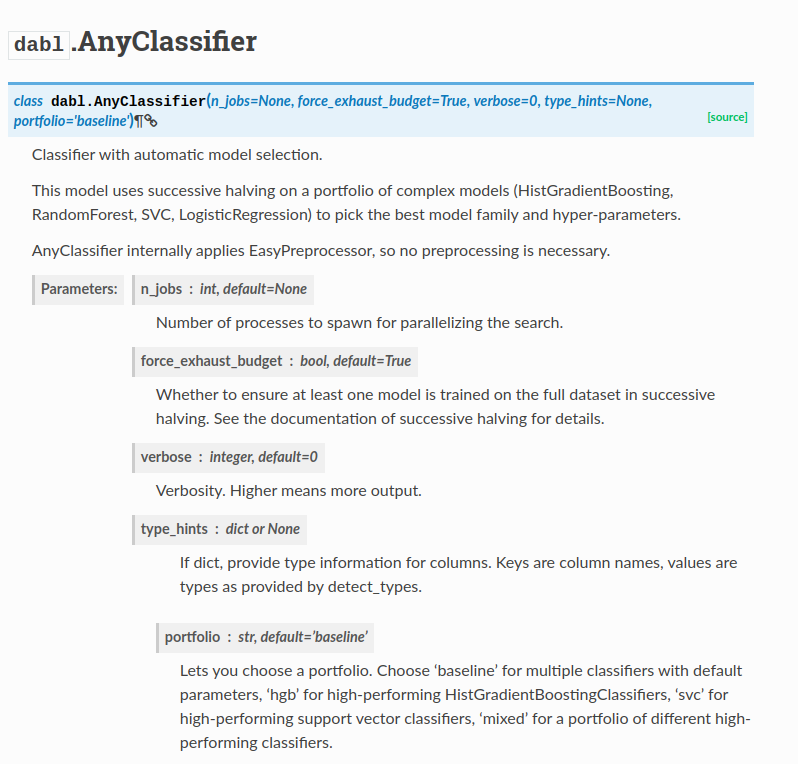
Auto-sklearn
end-to-end auto-ml
seaches a fixed sklearn pipeline (4 steps)
Warm-starting with meta-features & KNN
Bayesian Optimization with SMAC
https://automl.github.io/auto-sklearn/stable/index.html
Playing around with auto-sklearn
import autosklearn.classification
import sklearn.model_selection
import sklearn.datasets
from sklearn.metrics import accuracy_score
X, y = sklearn.datasets.load_digits(return_X_y=True)
X_train, X_test, y_train, y_test = \
    sklearn.model_selection.train_test_split(X, y, random_state=1)
automl = autosklearn.classification.AutoSklearnClassifier()
automl.fit(X_train, y_train)
y_hat = automl.predict(X_test)
print("Accuracy score", accuracy_score(y_test, y_hat))
“This will run for one hour and should result in an accuracy above 0.98.”
Practical Recommendations
Multi-Fidelity! Simple, effective!
Portfolios
BOHB / HpBandSter
auto-sklearn
TPot?
Seems promising:
Transfering surrogates / ensembles
Collaborative filtering / active testing
Criticisms
Do we need 100 classifiers?
Do we need Complex Pipelines?
Creates complex models and ensembles
“Making it too easy”?
Although we already reduced the space of considered ML algorithms substantially compared to our previous Auto-sklearn (4 vs. 15 classifiers), we could have reduced this set even further since, in the end, only XGBoost models ended up in the final ensembles for the challenge.
.quote_author[Feurer et al, PoSH auto-sklearn]
Questions ?
from sklearn.svm import SVC
param_grid = {'gamma': np.logspace(-3, 3, 7), 'C': np.logspace(-3, 3, 7)}
param_grid
{'gamma': array([1.e-03, 1.e-02, 1.e-01, 1.e+00, 1.e+01, 1.e+02, 1.e+03]),
 'C': array([1.e-03, 1.e-02, 1.e-01, 1.e+00, 1.e+01, 1.e+02, 1.e+03])}
tot_time = []
results = []
train_sizes = [0.1, 0.2, 0.4, 0.8]
for train_size in train_sizes:
    X_train, X_test, y_train, y_test = train_test_split(X / 16., y, stratify=y, random_state=1, train_size=train_size)
    grid_search = GridSearchCV(SVC(), param_grid=param_grid, iid=False)
    start = time.time()
    grid_search.fit(X_train, y_train)
    tot_time.append(time.time() - start)
    res = pd.DataFrame(grid_search.cv_results_).pivot(index='param_C', columns='param_gamma', values='mean_test_score')
    results.append(res)
/home/andy/checkout/scikit-learn/sklearn/model_selection/_split.py:2184: FutureWarning: From version 0.21, test_size will always complement train_size unless both are specified.
  FutureWarning)
/home/andy/checkout/scikit-learn/sklearn/model_selection/_split.py:2184: FutureWarning: From version 0.21, test_size will always complement train_size unless both are specified.
  FutureWarning)
/home/andy/checkout/scikit-learn/sklearn/model_selection/_split.py:2184: FutureWarning: From version 0.21, test_size will always complement train_size unless both are specified.
  FutureWarning)
/home/andy/checkout/scikit-learn/sklearn/model_selection/_split.py:2184: FutureWarning: From version 0.21, test_size will always complement train_size unless both are specified.
  FutureWarning)
fig, axes = plt.subplots(1, 4, figsize=(15, 4))
for i, ax in enumerate(axes):
    ax.imshow(results[i].values, vmin=.8, vmax=.99)
    ax.set_title("Data fraction: {}% time: {:.0f}s".format(train_sizes[i] * 100, tot_time[i]))
    ax.set_xticks(np.arange(7))
    ax.set_xticklabels(param_grid['gamma'])
    ax.set_xlabel('gamma')
    ax.set_yticks(np.arange(7))
    ax.set_yticklabels(param_grid['C'])
    ax.set_ylabel('C')
plt.suptitle("RBF-SVM parameters on digits dataset")
plt.savefig("images/multi-fidelity-digits.png")

n_estimators in Random Forest
from sklearn.tree import DecisionTreeClassifier
tree = DecisionTreeClassifier(max_features=2).fit(digits.data, digits.target)
tree.get_depth()
19
param_grid_rf = {'max_depth': [1, 2, 4, 8, 12, 16, 19], 'max_features': [2, 4, 8, 16, 32, 64]}
tot_time_rf = []
results_rf = []
n_estimators = [10, 40, 80, 160]
X_train, X_test, y_train, y_test = train_test_split(X / 16., y, stratify=y, random_state=1)

for n_ests in n_estimators:
    grid_search = GridSearchCV(RandomForestClassifier(n_estimators=n_ests), param_grid=param_grid_rf, iid=False)
    start = time.time()
    grid_search.fit(X_train, y_train)
    tot_time_rf.append(time.time() - start)
    res = pd.DataFrame(grid_search.cv_results_).pivot(index='param_max_depth', columns='param_max_features', values='mean_test_score')
    results_rf.append(res)
fig, axes = plt.subplots(1, 4, figsize=(15, 4))

for i, ax in enumerate(axes):
    im = ax.imshow(results_rf[i].values, vmin=.85, vmax=.98)
    ax.set_title("n_estimators: {} time: {:.0f}s".format(n_estimators[i], tot_time_rf[i]))
    ax.set_xticks(np.arange(len(param_grid_rf['max_features'])))
    ax.set_xticklabels(param_grid_rf['max_features'])
    ax.set_xlabel('max_features')
    ax.set_yticks(np.arange(len(param_grid_rf['max_depth'])))
    ax.set_yticklabels(param_grid_rf['max_depth'])
    ax.set_ylabel('max_depth')
#plt.colorbar(im, ax=axes)
plt.suptitle("Random Forest parameters on digits dataset")
plt.savefig("images/multi-fidelity-digits-rf.png")

np.log2(10000)
13.287712379549449
from civismlext import HyperbandSearchCV
# build a classifier
clf = RandomForestClassifier(n_estimators=20)


# Utility function to report best scores
def report(results, n_top=3):
    for i in range(1, n_top + 1):
        candidates = np.flatnonzero(results['rank_test_score'] == i)
        for candidate in candidates:
            print("Model with rank: {0}".format(i))
            print("Mean validation score: {0:.3f} (std: {1:.3f})".format(
                  results['mean_test_score'][candidate],
                  results['std_test_score'][candidate]))
            print("Parameters: {0}".format(results['params'][candidate]))
            print("")


# specify parameters and distributions to sample from
param_dist = {"max_depth": [3, None],
              "max_features": sp_randint(1, 11),
              "min_samples_split": sp_randint(2, 11),
              "bootstrap": [True, False],
              "criterion": ["gini", "entropy"]}


# use a full grid over all parameters
param_grid = {"max_depth": [3, None],
              "max_features": [1, 3, 10],
              "min_samples_split": [2, 3, 10],
              "bootstrap": [True, False],
              "criterion": ["gini", "entropy"]}
hp = HyperbandSearchCV(clf, param_distributions=param_dist, cost_parameter_max={'n_estimators': 200}, verbose=10)
hp.fit(X_train, y_train)
from halving import GridSuccessiveHalving
sh = GridSuccessiveHalving(clf, param_grid=param_grid, random_state=0)
start = time.time()
sh.fit(X_train, y_train)

print("Successive Halving took %.2f seconds for %d candidate parameter settings."
      % (time.time() - start, len(sh.cv_results_['params'])))
report(sh.cv_results_)
7
n_samples_iter: 100
n_samples_iter: 100
/home/andy/checkout/scikit-learn/sklearn/model_selection/_split.py:643: Warning: The least populated class in y has only 4 members, which is too few. The minimum number of members in any class cannot be less than n_splits=5.
  % (min_groups, self.n_splits)), Warning)
n_samples_iter: 100
/home/andy/checkout/scikit-learn/sklearn/model_selection/_split.py:643: Warning: The least populated class in y has only 3 members, which is too few. The minimum number of members in any class cannot be less than n_splits=5.
  % (min_groups, self.n_splits)), Warning)
n_samples_iter: 100
n_samples_iter: 100
n_samples_iter: 100
n_samples_iter: 100
Successive Halving took 12.32 seconds for 145 candidate parameter settings.
Model with rank: 1
Mean validation score: 0.885 (std: 0.035)
Parameters: {'bootstrap': False, 'criterion': 'gini', 'max_depth': None, 'max_features': 10, 'min_samples_split': 3}

Model with rank: 2
Mean validation score: 0.875 (std: 0.064)
Parameters: {'bootstrap': False, 'criterion': 'entropy', 'max_depth': None, 'max_features': 10, 'min_samples_split': 3}

Model with rank: 3
Mean validation score: 0.866 (std: 0.072)
Parameters: {'bootstrap': False, 'criterion': 'entropy', 'max_depth': None, 'max_features': 3, 'min_samples_split': 3}
sh.score(X_test, y_test)
0.9594285714285714
# run randomized search
n_iter_search = 20
random_search = RandomizedSearchCV(clf, param_distributions=param_dist,
                                   n_iter=n_iter_search, iid=False, verbose=10, random_state=0)

start = time.time()
random_search.fit(X_train, y_train)
print("RandomizedSearchCV took %.2f seconds for %d candidates"
      " parameter settings." % ((time.time() - start), n_iter_search))
report(random_search.cv_results_)
import pandas as pd
#.groupby("params").plot(x="iter", y="mean_test_score")
random_search.score(X_test, y_test)
0.9583428571428572
res = pd.DataFrame(sh.cv_results_)
res['params_str'] = res.params.apply(str)
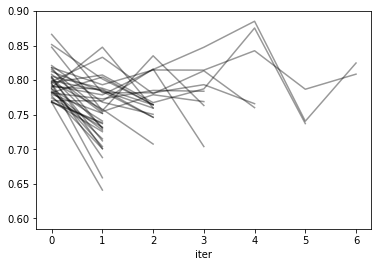
reshape = res.pivot(index='iter', columns='params_str', values='mean_test_score')
reshape.plot(legend=False, alpha=.4, c='k')
<matplotlib.axes._subplots.AxesSubplot at 0x7f2b0164a7b8>
import matplotlib.pyplot as plt
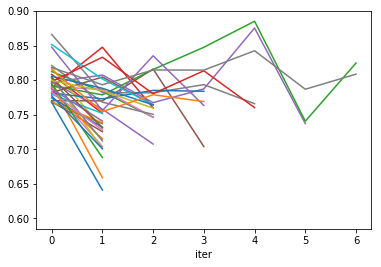
res.groupby("params_str").plot('iter', 'mean_test_score', ax=plt.gca(), legend=False);
plt.savefig("images/halving_curve.png")
%matplotlib inline
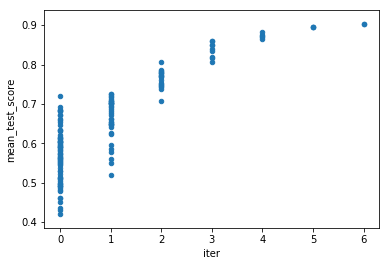
res.plot('iter', 'mean_test_score', kind='scatter')
<matplotlib.axes._subplots.AxesSubplot at 0x7f0196c080f0>
X_train, X_test, y_train, y_test = train_test_split(X / 255., y, stratify=y, random_state=0, train_size=1000)
/home/andy/checkout/scikit-learn/sklearn/model_selection/_split.py:2184: FutureWarning: From version 0.21, test_size will always complement train_size unless both are specified.
  FutureWarning)
from sklearn.svm import SVC
param_grid = {'gamma': np.logspace(-3, 2, 6), 'C': np.logspace(-3, 2, 6)}
param_grid
{'gamma': array([1.e-03, 1.e-02, 1.e-01, 1.e+00, 1.e+01, 1.e+02]),
 'C': array([1.e-03, 1.e-02, 1.e-01, 1.e+00, 1.e+01, 1.e+02])}
# run grid search
grid_search = GridSearchCV(SVC(), param_grid=param_grid, iid=False, verbose=0)
start = time.time()
grid_search.fit(X_train, y_train)

print("GridSearchCV took %.2f seconds for %d candidate parameter settings."
      % (time.time() - start, len(grid_search.cv_results_['params'])))
report(grid_search.cv_results_)
X_train, X_test, y_train, y_test = train_test_split(X / 255., y, stratify=y, random_state=0)

sh = GridSuccessiveHalving(SVC(), param_grid=param_grid, random_state=0, verbose=0)
start = time.time()
sh.fit(X_train, y_train)

print("Successive Halving took %.2f seconds for %d candidate parameter settings."
      % (time.time() - start, len(sh.cv_results_['params'])))
report(sh.cv_results_)
grid_search.score(X_test, y_test)
0.9194666666666667
sh.score(X_test, y_test)
0.9187536231884058
%matplotlib inline
import pandas as pd

res = pd.DataFrame(sh.cv_results_)
res['params_str'] = res.params.apply(str)
reshape = res.pivot(index='iter', columns='params_str', values='mean_test_score')
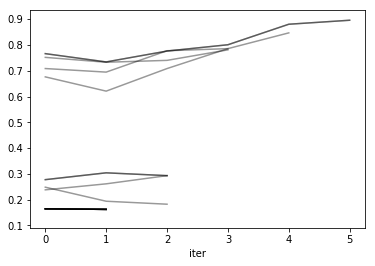
reshape.plot(legend=False, alpha=.4, c='k')
<matplotlib.axes._subplots.AxesSubplot at 0x7f48ffb91898>
reshape
| params_str | {'C': 0.001, 'gamma': 0.001} | {'C': 0.001, 'gamma': 0.01} | {'C': 0.001, 'gamma': 0.1} | {'C': 0.001, 'gamma': 1.0} | {'C': 0.001, 'gamma': 10.0} | {'C': 0.001, 'gamma': 100.0} | {'C': 0.01, 'gamma': 0.001} | {'C': 0.01, 'gamma': 0.01} | {'C': 0.01, 'gamma': 0.1} | {'C': 0.01, 'gamma': 1.0} | ... | {'C': 10.0, 'gamma': 0.1} | {'C': 10.0, 'gamma': 1.0} | {'C': 10.0, 'gamma': 10.0} | {'C': 10.0, 'gamma': 100.0} | {'C': 100.0, 'gamma': 0.001} | {'C': 100.0, 'gamma': 0.01} | {'C': 100.0, 'gamma': 0.1} | {'C': 100.0, 'gamma': 1.0} | {'C': 100.0, 'gamma': 10.0} | {'C': 100.0, 'gamma': 100.0} |
|---|---|---|---|---|---|---|---|---|---|---|---|---|---|---|---|---|---|---|---|---|---|
| iter | |||||||||||||||||||||
| 0 | 0.164668 | 0.164668 | 0.129374 | 0.129374 | 0.164668 | 0.141138 | 0.164668 | 0.164668 | 0.129374 | 0.129374 | ... | 0.277687 | 0.129374 | 0.164668 | 0.141138 | 0.751719 | 0.766145 | 0.277687 | 0.129374 | 0.164668 | 0.141138 |
| 1 | 0.162487 | NaN | NaN | NaN | NaN | NaN | 0.162487 | 0.162487 | NaN | NaN | ... | 0.304140 | NaN | 0.162487 | NaN | 0.732745 | 0.733937 | 0.304140 | NaN | 0.162487 | NaN |
| 2 | NaN | NaN | NaN | NaN | NaN | NaN | NaN | NaN | NaN | NaN | ... | 0.293254 | NaN | NaN | NaN | 0.740079 | 0.776190 | 0.293254 | NaN | NaN | NaN |
| 3 | NaN | NaN | NaN | NaN | NaN | NaN | NaN | NaN | NaN | NaN | ... | NaN | NaN | NaN | NaN | 0.780840 | 0.800602 | NaN | NaN | NaN | NaN |
| 4 | NaN | NaN | NaN | NaN | NaN | NaN | NaN | NaN | NaN | NaN | ... | NaN | NaN | NaN | NaN | NaN | 0.880104 | NaN | NaN | NaN | NaN |
| 5 | NaN | NaN | NaN | NaN | NaN | NaN | NaN | NaN | NaN | NaN | ... | NaN | NaN | NaN | NaN | NaN | 0.895587 | NaN | NaN | NaN | NaN |
6 rows × 36 columns
bla = res.groupby('params_str')['mean_test_score'].median()
new = res.drop_duplicates(subset='params_str', keep='last')[['param_gamma', 'param_C', 'mean_test_score']]
new.pivot(index='param_C', columns='param_gamma')
| mean_test_score | ||||||
|---|---|---|---|---|---|---|
| param_gamma | 0.001 | 0.010 | 0.100 | 1.000 | 10.000 | 100.000 |
| param_C | ||||||
| 0.001 | 0.162487 | 0.164668 | 0.129374 | 0.129374 | 0.164668 | 0.141138 |
| 0.010 | 0.162487 | 0.162487 | 0.129374 | 0.129374 | 0.162487 | 0.141138 |
| 0.100 | 0.162487 | 0.164668 | 0.129374 | 0.129374 | 0.162487 | 0.141138 |
| 1.000 | 0.182540 | 0.846617 | 0.293254 | 0.129374 | 0.162487 | 0.141138 |
| 10.000 | 0.785551 | 0.895587 | 0.293254 | 0.129374 | 0.162487 | 0.141138 |
| 100.000 | 0.780840 | 0.895587 | 0.293254 | 0.129374 | 0.162487 | 0.141138 |
import matplotlib.pyplot as plt
%matplotlib inline
plt.imshow(new.pivot(index='param_C', columns='param_gamma'))
<matplotlib.image.AxesImage at 0x7f48feefe908>
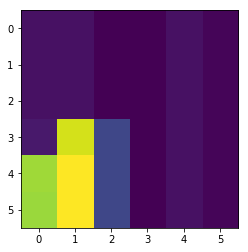
res.drop_duplicates(subset='params_str', keep='last')[['param_gamma', 'param_C', 'iter']].pivot(index='param_C', columns='param_gamma')
| iter | ||||||
|---|---|---|---|---|---|---|
| param_gamma | 0.001 | 0.010 | 0.100 | 1.000 | 10.000 | 100.000 |
| param_C | ||||||
| 0.001 | 1 | 0 | 0 | 0 | 0 | 0 |
| 0.010 | 1 | 1 | 0 | 0 | 1 | 0 |
| 0.100 | 1 | 0 | 0 | 0 | 1 | 0 |
| 1.000 | 2 | 4 | 2 | 0 | 1 | 0 |
| 10.000 | 3 | 5 | 2 | 0 | 1 | 0 |
| 100.000 | 3 | 5 | 2 | 0 | 1 | 0 |
from sklearn.linear_model import LogisticRegression, LogisticRegressionCV
start = time.time()
LogisticRegressionCV(multi_class='multinomial', solver='sag').fit(X_train, y_train)
print(time.time() - start)
np.logspace(-3, 2, 6)
array([ 0.001, 0.01 , 0.1 , 1. , 10. , 100. ])
27 * 3
81
n_params = 81
n_samples = 10000
eta = 3.
budget = 23000
l = np.arange(15)
s = np.where(np.floor(n_params * n_samples * (l + 1) * eta ** -l) < budget)[0].min()
s
5
s = 5
resources_spent = 0
for k in range(0, s + 1):
    n_params_left = np.floor(n_params*eta ** -k)
    if n_params_left < 1:
        break
    resources =  np.floor(n_samples * eta ** (k - s))
    resources_spent += n_params_left * resources
    print("train {} configurations with resources {}".format(int(n_params_left), int(resources)))
print("resources total: {}".format(resources_spent))
train 81 configurations with resources 41
train 27 configurations with resources 123
train 9 configurations with resources 370
train 3 configurations with resources 1111
train 1 configurations with resources 3333
resources total: 16638.0
k
5
n_params
16

