Note
Click here to download the full example code
Ames Housing Dataset Visualization
Out:
/home/circleci/project/dabl/plot/supervised.py:526: FutureWarning: The second positional argument of plot is a Series 'y'. If passing a column name, use a keyword.
FutureWarning)
/home/circleci/project/dabl/preprocessing.py:318: UserWarning: Discarding near-constant features: ['Street', 'Utilities', 'Land Slope', 'Condition 2', 'Roof Matl', 'Heating', 'Low Qual Fin SF', 'Kitchen AbvGr', 'Garage Cond', '3Ssn Porch', 'Pool Area', 'Misc Val']
near_constant.index[near_constant].tolist()))
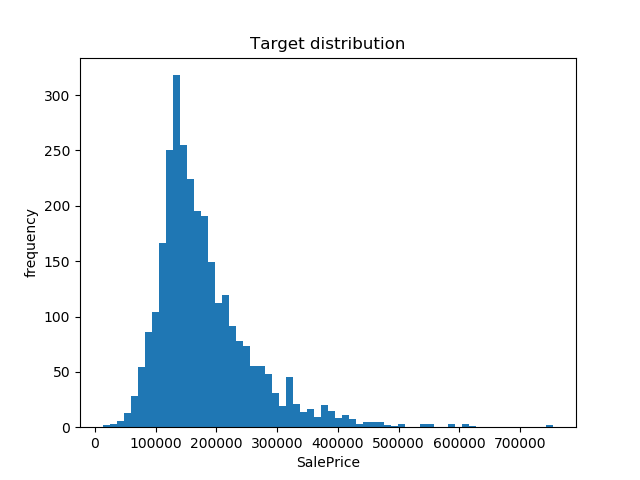
Target looks like regression
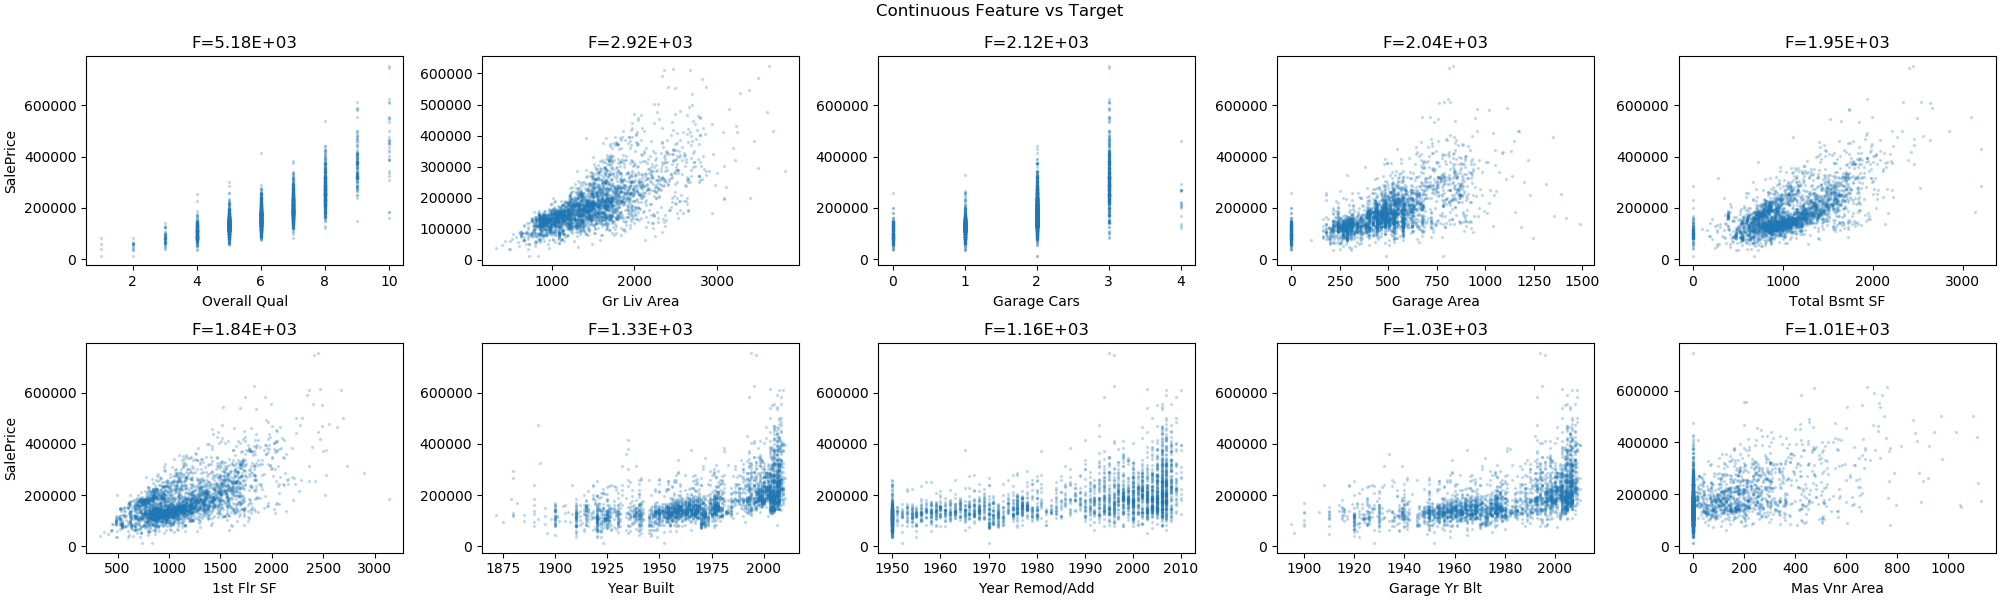
Showing only top 10 of 26 continuous features
/home/circleci/project/dabl/plot/utils.py:571: UserWarning: Dropped 5 outliers in column Gr Liv Area.
int(dropped), series.name), UserWarning)
/home/circleci/project/dabl/plot/utils.py:571: UserWarning: Dropped 1 outliers in column Garage Cars.
int(dropped), series.name), UserWarning)
/home/circleci/project/dabl/plot/utils.py:571: UserWarning: Dropped 2 outliers in column Total Bsmt SF.
int(dropped), series.name), UserWarning)
/home/circleci/project/dabl/plot/utils.py:571: UserWarning: Dropped 4 outliers in column 1st Flr SF.
int(dropped), series.name), UserWarning)
/home/circleci/project/dabl/plot/utils.py:571: UserWarning: Dropped 1 outliers in column Garage Yr Blt.
int(dropped), series.name), UserWarning)
/home/circleci/project/dabl/plot/utils.py:571: UserWarning: Dropped 7 outliers in column Mas Vnr Area.
int(dropped), series.name), UserWarning)
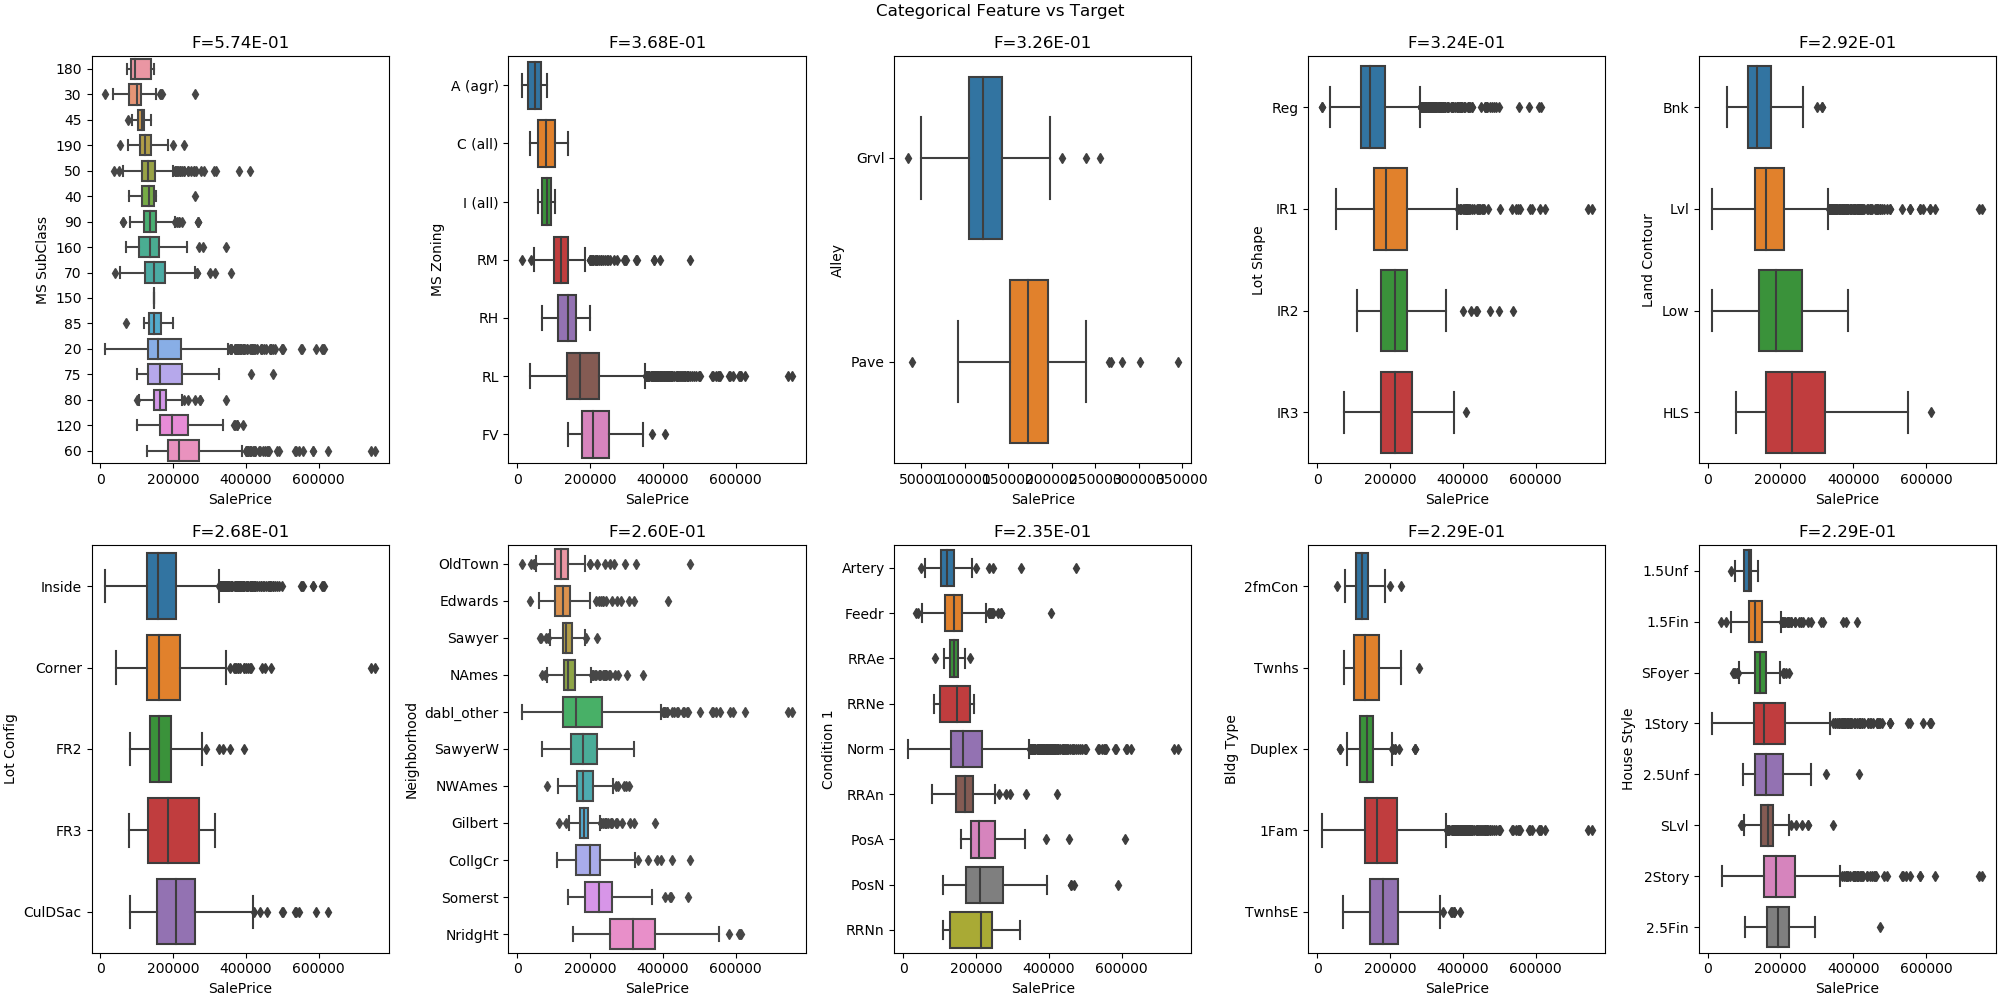
Showing only top 10 of 42 categorical features
# sphinx_gallery_thumbnail_number = 3
from dabl import plot
from dabl.datasets import load_ames
import matplotlib.pyplot as plt

# load the ames housing dataset
# returns a plain dataframe
data = load_ames()

plot(data, 'SalePrice')
plt.show()
Total running time of the script: ( 0 minutes 4.461 seconds)