Note
Click here to download the full example code
Class Histogram Example
import matplotlib.pyplot as plt
from dabl.datasets import load_adult
from dabl.plot import class_hists
data = load_adult()
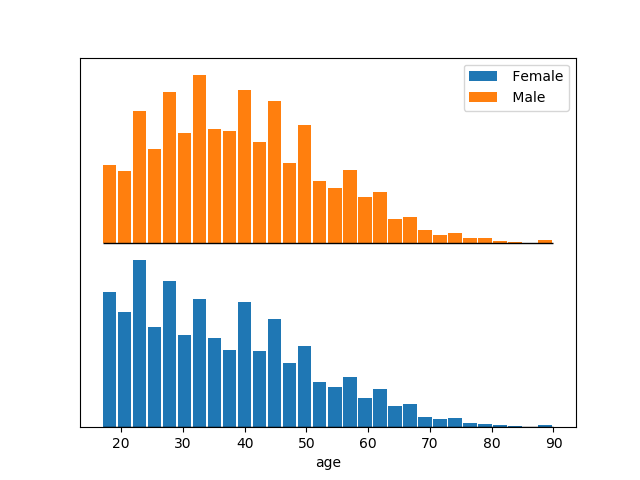
# Plots the histogram of age per gender
class_hists(data, "age", "gender", legend=True)
plt.show()
Total running time of the script: ( 0 minutes 0.152 seconds)