Note
Click here to download the full example code
Diamonds Dataset Visualization
Regression on the classical diamond dataset.
Out:
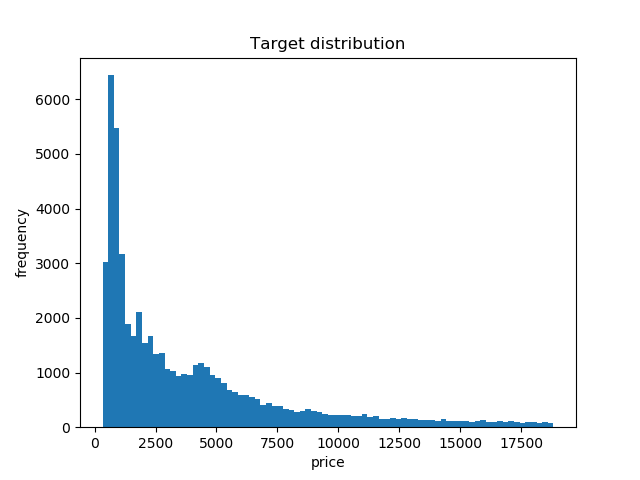
Target looks like regression
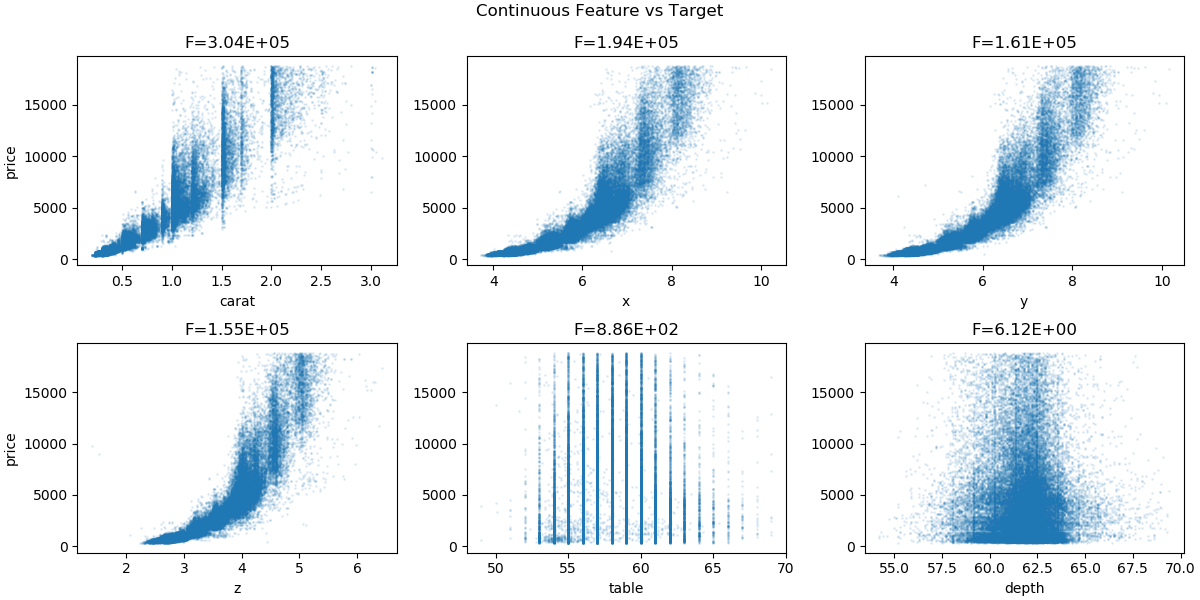
/home/circleci/project/dabl/plot/utils.py:571: UserWarning: Dropped 13 outliers in column carat.
  int(dropped), series.name), UserWarning)
/home/circleci/project/dabl/plot/utils.py:571: UserWarning: Dropped 9 outliers in column x.
  int(dropped), series.name), UserWarning)
/home/circleci/project/dabl/plot/utils.py:571: UserWarning: Dropped 10 outliers in column y.
  int(dropped), series.name), UserWarning)
/home/circleci/project/dabl/plot/utils.py:571: UserWarning: Dropped 25 outliers in column z.
  int(dropped), series.name), UserWarning)
/home/circleci/project/dabl/plot/utils.py:571: UserWarning: Dropped 19 outliers in column table.
  int(dropped), series.name), UserWarning)
/home/circleci/project/dabl/plot/utils.py:571: UserWarning: Dropped 52 outliers in column depth.
  int(dropped), series.name), UserWarning)
# sphinx_gallery_thumbnail_number = 2
import matplotlib.pyplot as plt
from sklearn.datasets import fetch_openml
from dabl import plot

X, y = fetch_openml('diamonds', as_frame=True, return_X_y=True)

plot(X, y)
plt.show()
Total running time of the script: ( 0 minutes 7.383 seconds)


